8 September 2026 · updated 25 September 2026 · 10 min read · ROAS Chart
What is a good ROAS?
Ask this in any marketing group and you will get a number back within seconds. Three. Four. Two and a half if you are in fashion. Every one of those answers is guesswork, because a good ROAS is not a number you can be told. It is a number you calculate.
The short answer
A good ROAS is any ROAS above your break-even ROAS. Your break-even ROAS is the point where the revenue your ads generate exactly covers what it cost to generate it, plus everything else your business pays for that month.
That number is personal. Two shops running the same campaign, on the same platform, in the same country, can have break-even points that are twice as far apart, because they buy their stock at different prices and pay different rent.
Why "3x is good" is meaningless
A 3x ROAS means every dirham of ad spend returned three dirhams of revenue. Revenue, not profit. Before you keep any of it you still pay for the product, the shipping, the packaging, the payment gateway, the refunds, and the VAT on the ad spend itself.
If your gross margin is 30%, a 3x ROAS loses money on every order. If your margin is 70%, the same 3x is comfortable. The number on its own carries no information.
Step one: what is actually left from a sale
Take one order and subtract everything that scales with it:
- the cost of the goods
- shipping, packaging and any cash-on-delivery fee
- the payment gateway percentage
- the share lost to refunds and returns
What remains is your contribution margin. On an order of AED 350 with a 60% gross margin, AED 20 of shipping and a 2.9% gateway fee, roughly AED 180 survives. That is 51% of the sale.
Flip it, and you get the simple version of break-even ROAS: 1 divided by 0.51, or about 1.95x. Below that, every order loses money no matter how many you sell.
Step two: the part almost every calculator skips
That 1.95x assumes your business has no costs beyond the orders themselves. It has. Salaries, rent, software, an agency retainer. Those bills arrive whether you sell nothing or everything.
Fixed costs have to be paid out of the same margin, which means your real break-even ROAS is higher than the simple version. And here is the part that changes how you should think about scaling: it changes with how much you spend.
Spend a little and your fixed costs are spread over a little revenue, so each dirham of advertising has to work very hard. Spend more and the same fixed costs are spread thinner.
What that looks like in numbers
Same shop as above, with AED 27,000 a month of salaries and overheads:
| Monthly ad spend | Break-even ROAS |
|---|---|
| AED 15,000 | 5.45x |
| AED 30,000 | 3.70x |
| AED 60,000 | 2.82x |
| AED 120,000 | 2.38x |
These figures leave out VAT on ad spend. The calculator adds 5% by default, which nudges every number up slightly; you can switch it off to match the table exactly.
A 3x ROAS is a loss at AED 30,000 a month and a profit at AED 60,000. Identical campaign performance, opposite outcomes. This is why one shop swears 3x is fine and another insists you need 5x, and both are telling the truth about their own business.
Is a 2x ROAS good?
2x is where many campaigns settle, and it sits right on the line for a lot of stores.
A candle brand sells at an average of $45. The product costs just $9, an 80% gross margin. Shipping is $5, payments 3%, and only 2% of orders are refunded. One order leaves $28.93, a contribution margin of 64.3%. That puts its floor — the lowest ROAS that could ever break even — at 1.56x, so 2x is above it. Whether a 2x month actually makes money depends on fixed costs, which are $4,000.
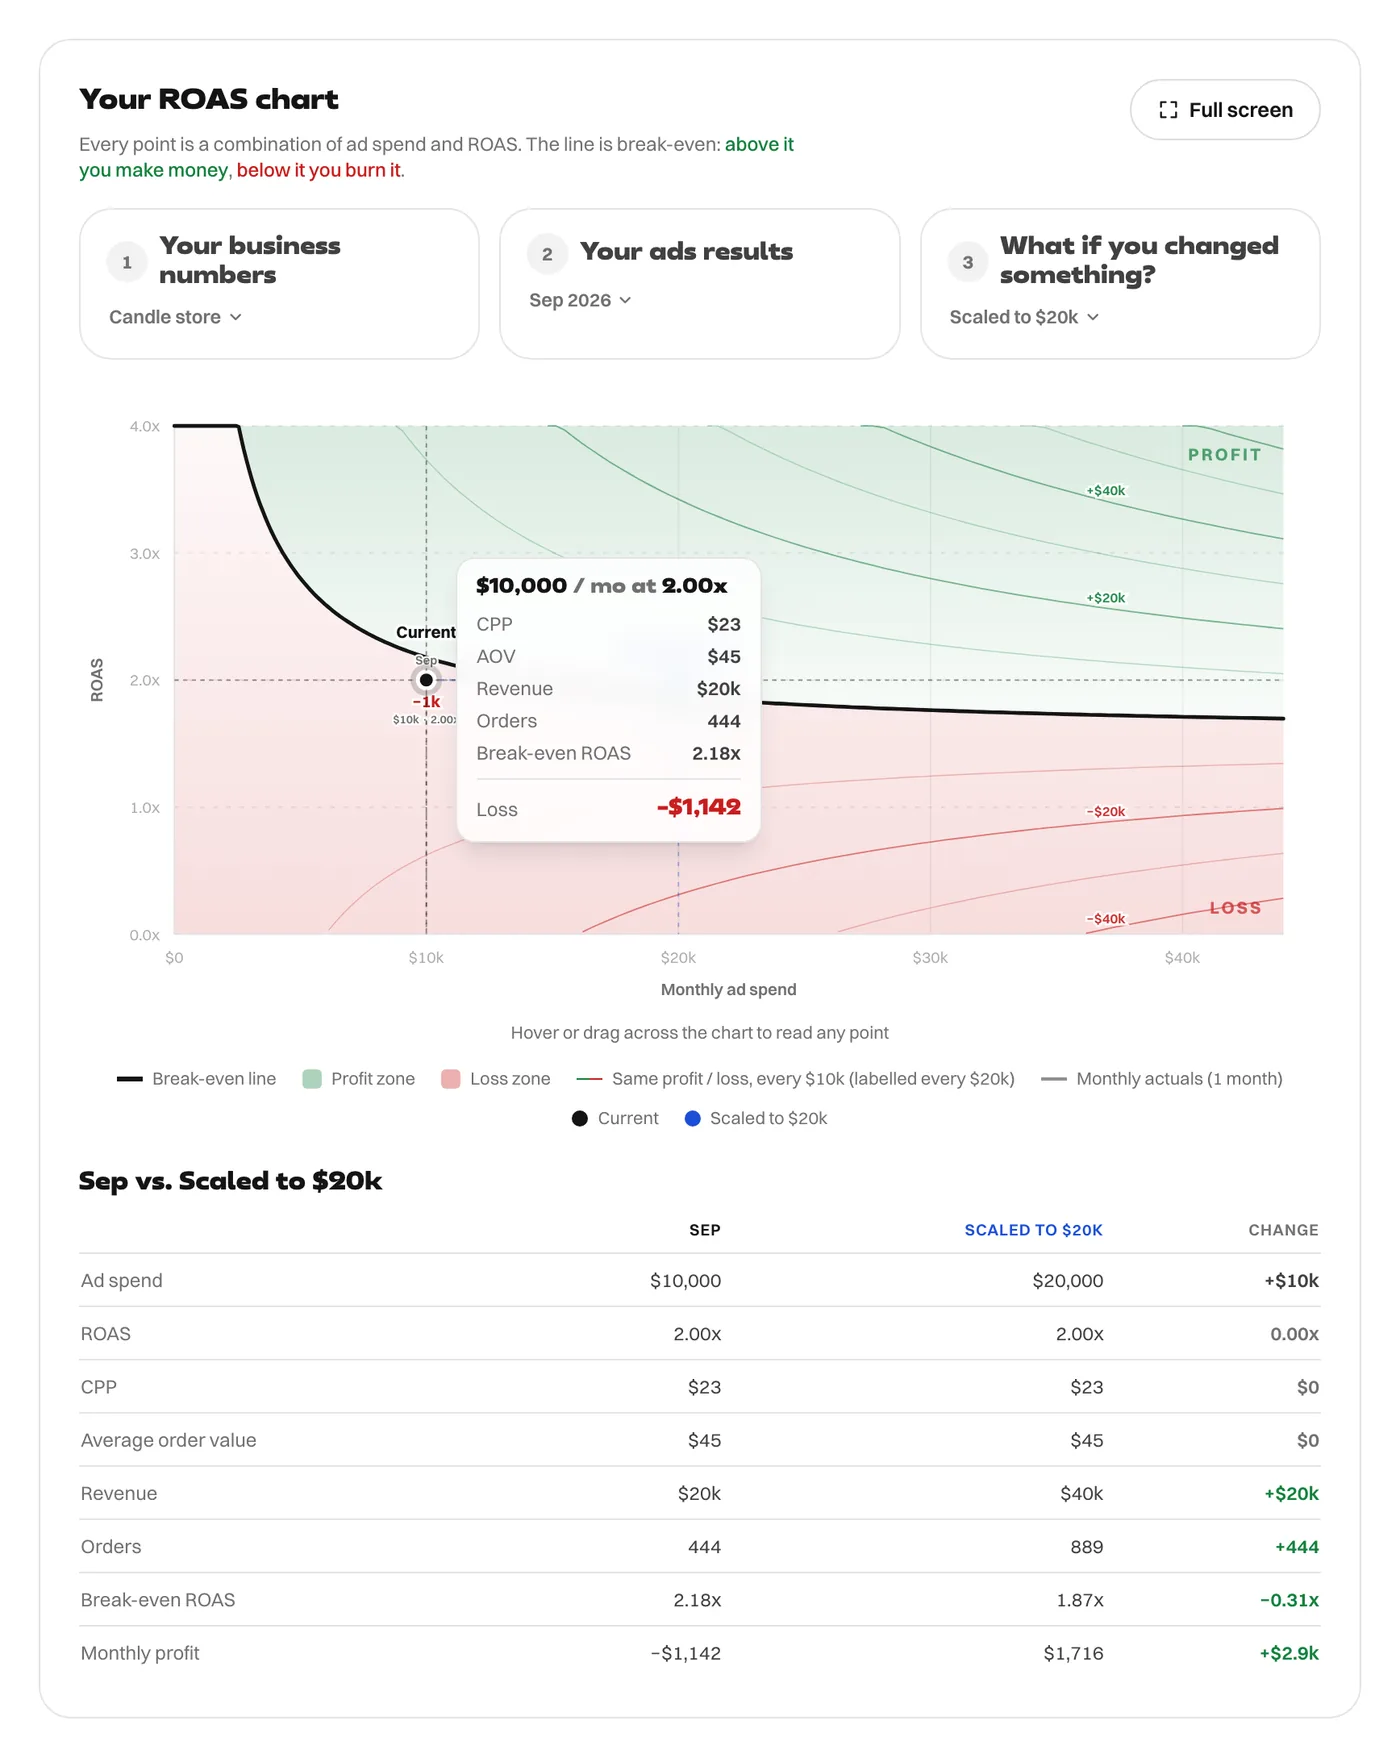
At $10,000 a month, break-even is 2.18x and the 2x month loses $1,142. At $20,000, the same fixed costs are spread over twice the revenue, break-even drops to 1.87x, and the same 2x makes $1,716. The ROAS did not change. The spend did.
Two warnings. The example assumes the store can double its budget and hold 2x, and ROAS usually falls as you scale. And if your contribution margin is under 50%, 2x is below your floor: each order loses money before fixed costs, and more spend only makes the loss bigger. For most stores with a 40–60% gross margin, the floor lands somewhere between 2.2x and 3.3x, which makes 2x a loss at any budget.
Is a 3x ROAS good?
3x is the number people quote most often as "good". Here are two stores with identical ad results.
An apparel brand. Average order $70, 50% gross margin, $7 shipping, a 3% payment fee and, because clothes get sent back, 12% of orders refunded. Fixed costs $10,000 a month. One order leaves $21.70, a contribution margin of 31.0%. This month it spent $20,000 and got exactly 3.00x.
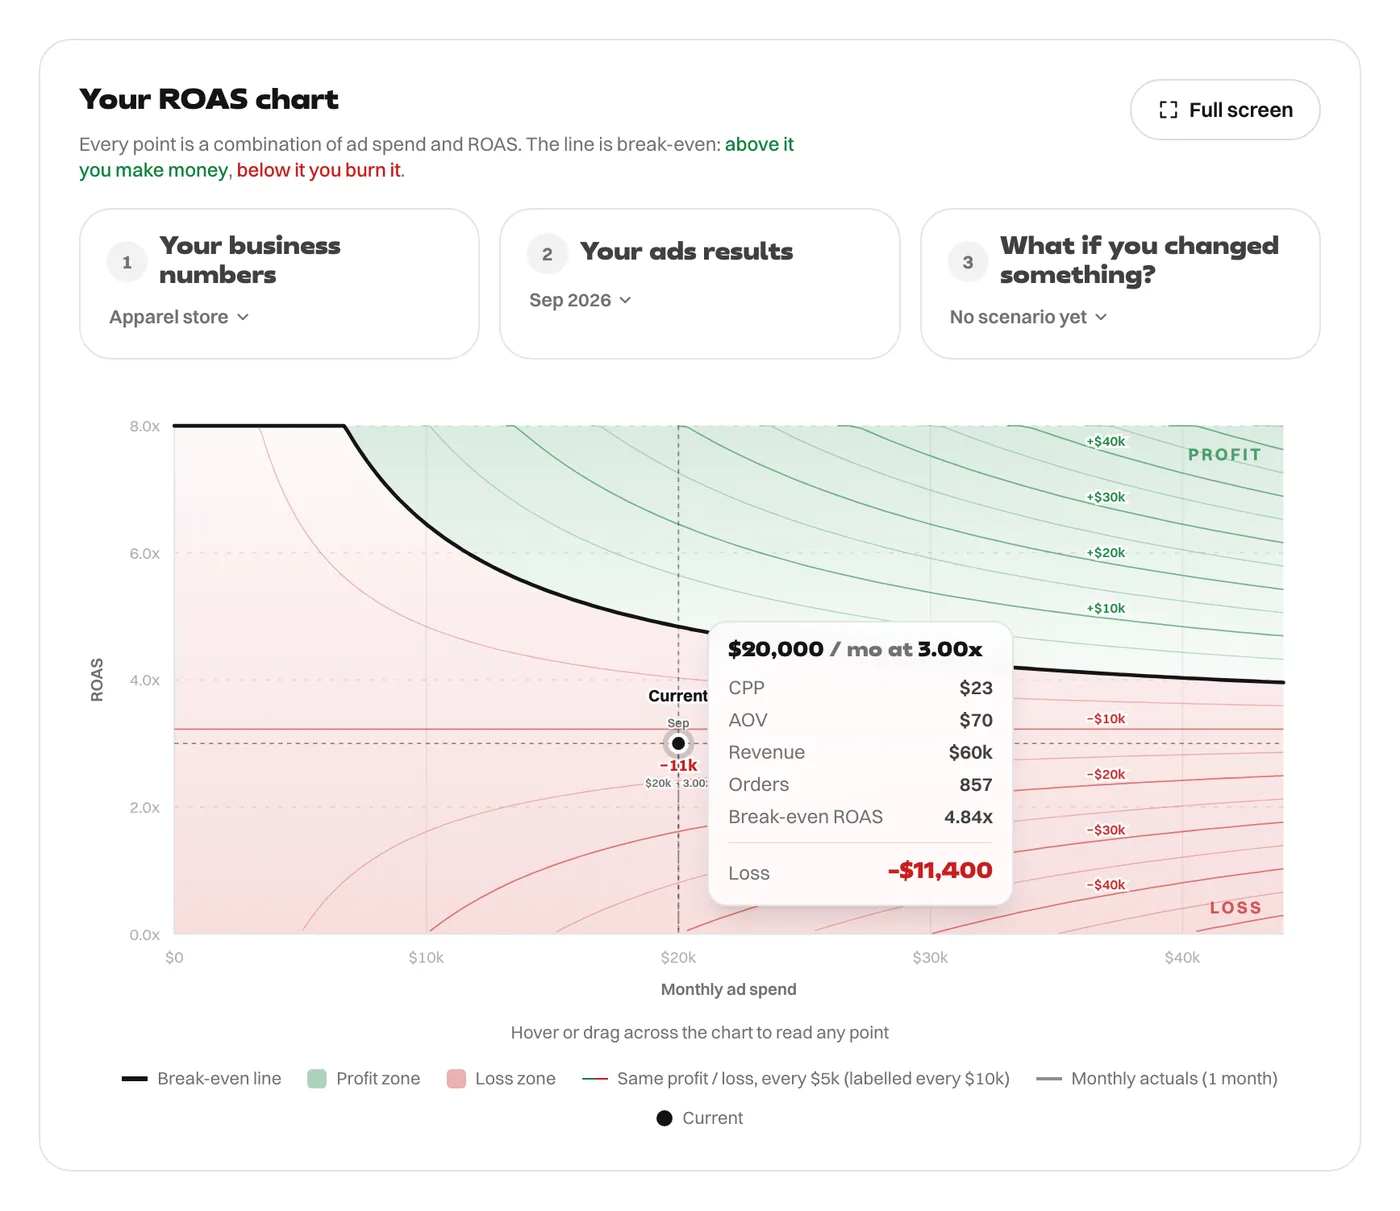
Break-even at that spend is 4.84x, and the month loses $11,400. Spending more will not rescue it: even at $200,000 a month break-even is still 3.39x, and the lowest it can ever go is 3.23x. At 3x this store loses money on every order before it has paid a single salary.
A supplements brand. Average order $50, 75% gross margin, $5 shipping, a 3% payment fee and 3% refunds. Same $10,000 of fixed costs, same $20,000 of spend, same 3x.
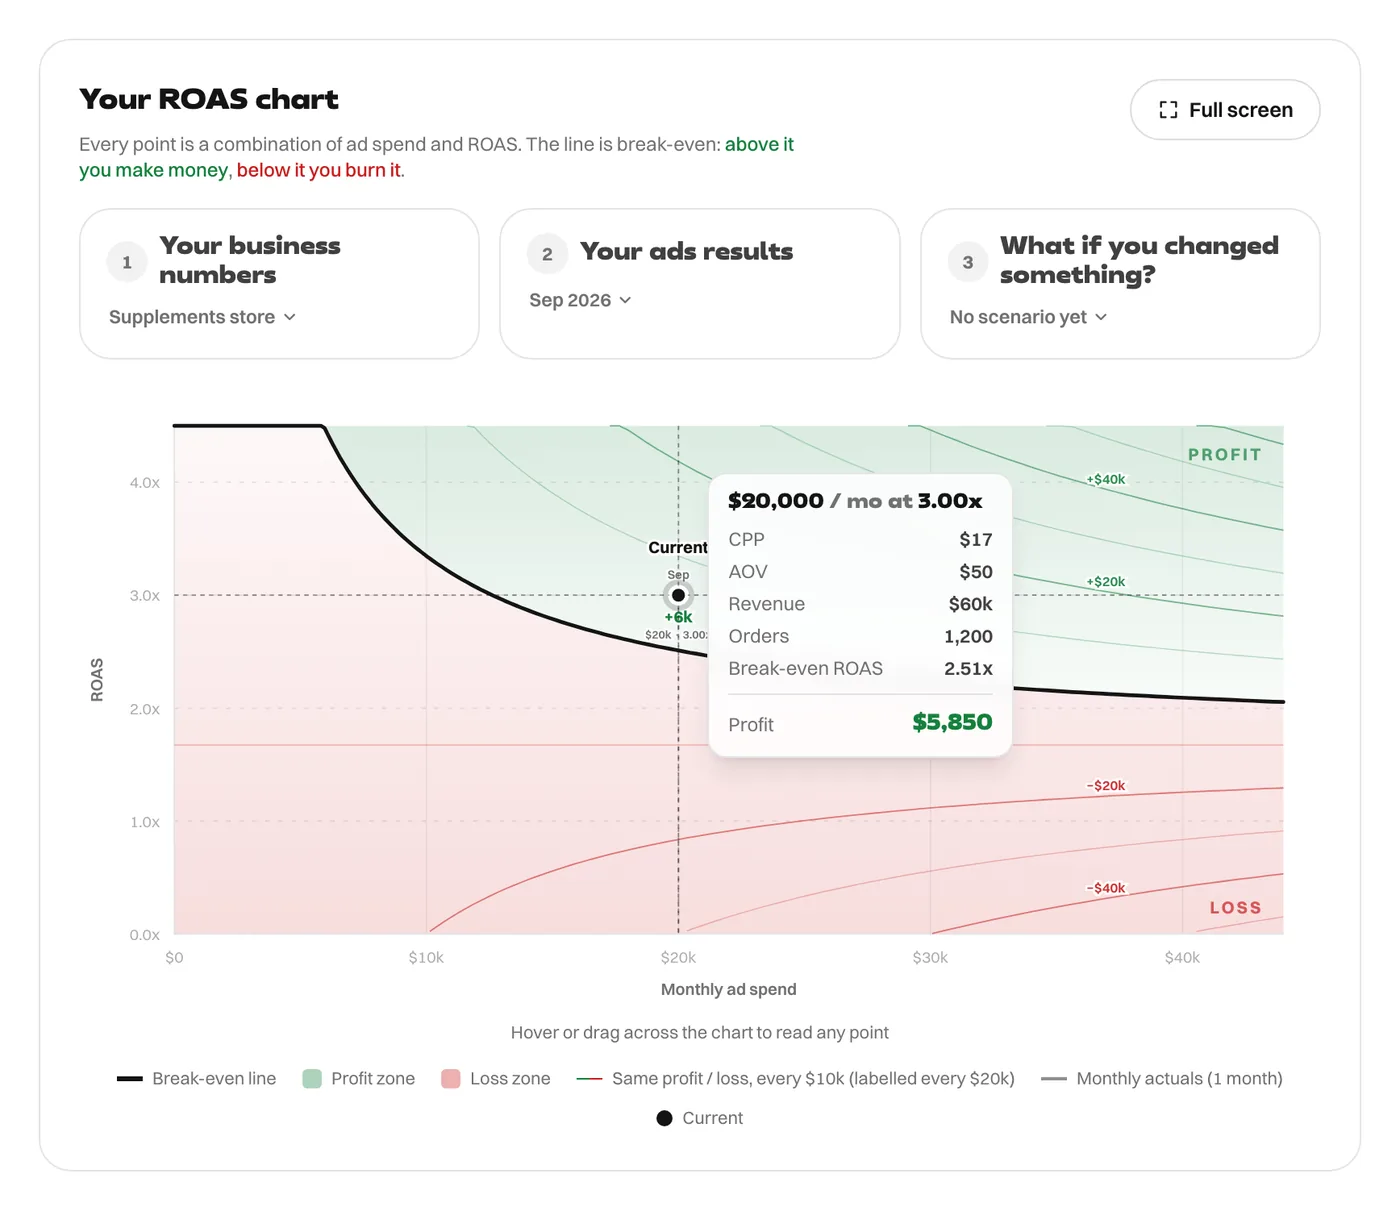
One order leaves $29.88, a 59.8% contribution margin. Break-even at $20,000 is 2.51x, and the month makes $5,850.
ROAS measures revenue, and revenue is not what you keep. At 3x, every $1 of ads brings in $3 of sales. The apparel store keeps about 93 cents of that, less than the dollar it paid for the ad. The supplements store keeps about $1.79.
Is a 4x ROAS good?
4x is the figure many media buyers are proud to report. For a store selling low-price, low-margin products it can be a loss on every order.
A phone accessories store sells cases and cables at an average of $40. The products cost $26, a 35% gross margin. Shipping is $6, payments 3%, and 5% of orders are refunded. One order leaves $6.10 — a contribution margin of 15.3%, which puts the floor at 6.56x. This month it spent $12,000 and hit 4x, $48,000 of revenue.
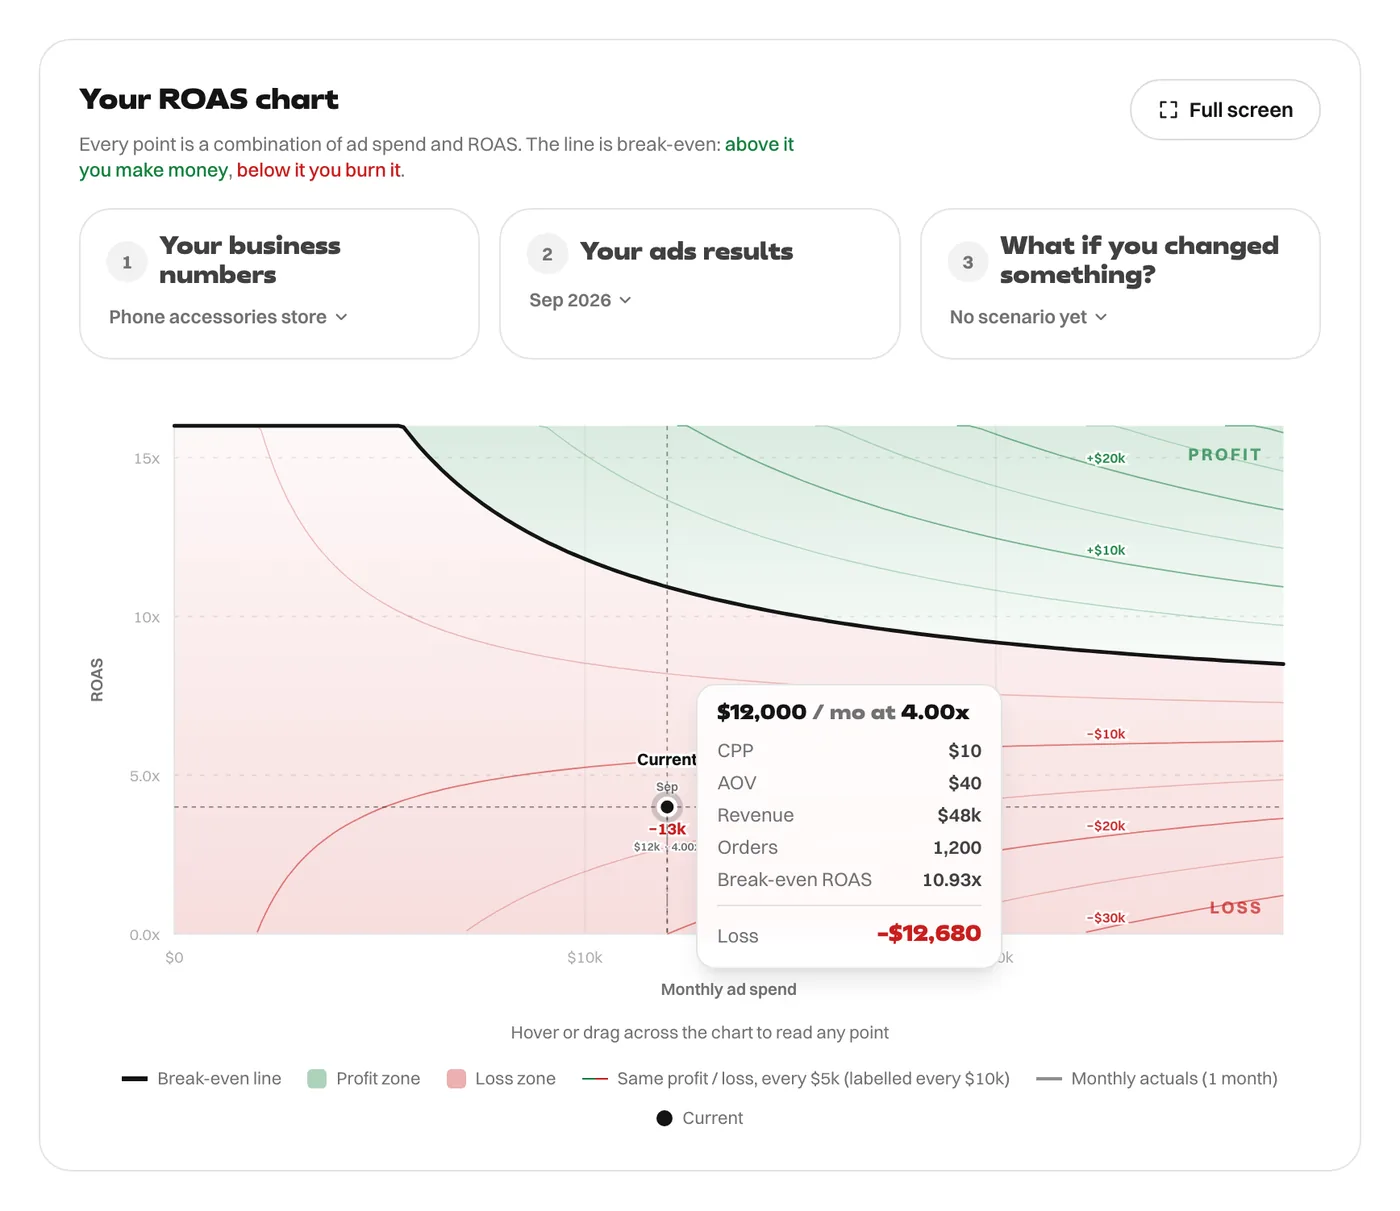
Break-even at that spend is 10.93x, and the month loses $12,680 — more than the ad budget itself. Every dollar of ads brought in $4 of sales, and those sales kept $0.61 after their own costs, so each dollar lost about $0.39 before a single fixed cost. Scaling makes it worse: even at $100,000 a month, break-even would be 7.08x.
Two things combine. A low gross margin leaves only a third of each sale after the product. And $6 of shipping on a $40 order is 15% of revenue, where on a $120 order it would be 5%. Low-price products with low margins are the classic trap: the ROAS looks excellent, revenue grows, and the bank balance shrinks. The fixes are all outside the ad account — bigger orders, better product costs, cheaper fulfilment. With everything else unchanged, this store's floor would drop below 4x at an average order of about $115.
The test that works for any ROAS
Multiply the ROAS by your contribution margin. If the answer is below 1, that ROAS loses money on every order, and no budget will fix it. For the phone accessories store, 4 × 0.153 = 0.61. For the supplements brand, 3 × 0.598 = 1.79.
If the answer is above 1, the surplus is what covers your fixed costs — which is why the budget matters as much as the ROAS, and why the same number is a loss at one spend and a profit at another.
What this means for scaling
Two things follow, and they matter more than any benchmark.
Scaling can rescue a campaign that looks broken. If you are close to break-even and your fixed costs are heavy, spending more can move you into profit at the same ROAS, because the overhead is spread further. Cutting spend in a panic can do the opposite.
But scale has a floor. The line falls toward your contribution-margin break-even and never goes below it. If your margin cannot support the ROAS you actually get, no budget will fix it. At that point the lever is price, product cost, shipping or offer, not media buying.
So what is a good ROAS for you?
Work out what is left from one order, add up your monthly fixed costs, and compare the result against the budget you actually run. The answer will be a specific number for your business, and it will be more useful than any benchmark from a forum.
You can do it on paper in ten minutes, or you can use the free calculator on this site, which draws the whole line and shows you exactly where your campaigns sit against it.
Want the formulas rather than the explanation? They are all written out on the math behind it.