· 3 min read · Amir Emad
Cash on delivery in the UAE: what COD does to your break-even ROAS
Cash on delivery is how a large share of UAE online shoppers still like to pay. It helps conversion rates, but it also raises what each order costs you and inflates the ROAS your ad platform reports. Together, those two effects can hide a serious loss.
Why cash on delivery changes your numbers
In the UAE, many shoppers still prefer to pay the courier. Offering cash on delivery (COD) can lift conversion rates, and plenty of stores treat it as essential. It also changes your unit economics in three ways that your ad dashboard does not show:
- Not every COD order is paid for. Some are refused at the door, some customers cannot be reached. Meta counts the purchase when the order is placed, so reported ROAS includes revenue you never receive.
- Every COD delivery costs more. Couriers usually charge a fee for collecting cash, on top of the delivery fee.
- Failed deliveries still cost money. The courier is paid for the attempt, so the orders that do complete carry the cost of the ones that did not.
There is one saving: no card payment fee on COD orders.
A worked example
A Dubai fashion accessories store sells at an average of AED 180 with a 60% gross margin. Delivery costs AED 18, card payments 2.9%, and 3% of orders are refunded. Fixed costs are AED 22,000 a month, and the business is not VAT-registered, so it pays 5% VAT on its ads.
It spends AED 30,000 a month on Meta, and Ads Manager reports a 4.00x ROAS. If every order were prepaid and delivered, that month would be roughly break-even: the line sits at 3.94x and the month makes AED 860.
Now suppose all its orders are cash on delivery, with these assumptions:
- a COD fee of AED 12 on top of the AED 18 delivery
- 1 in 5 COD orders never completes, so only 80% of reported sales turn into cash
- each completed order carries the delivery cost of the failed ones: (AED 18 + AED 12) ÷ 0.8 = AED 37.50
- no card fee
The real ROAS is 80% of what Meta reports: 4.00x × 0.8 = 3.20x. And each order now leaves AED 67.26 instead of AED 81.54, a contribution margin of 37.4% instead of 45.3%.
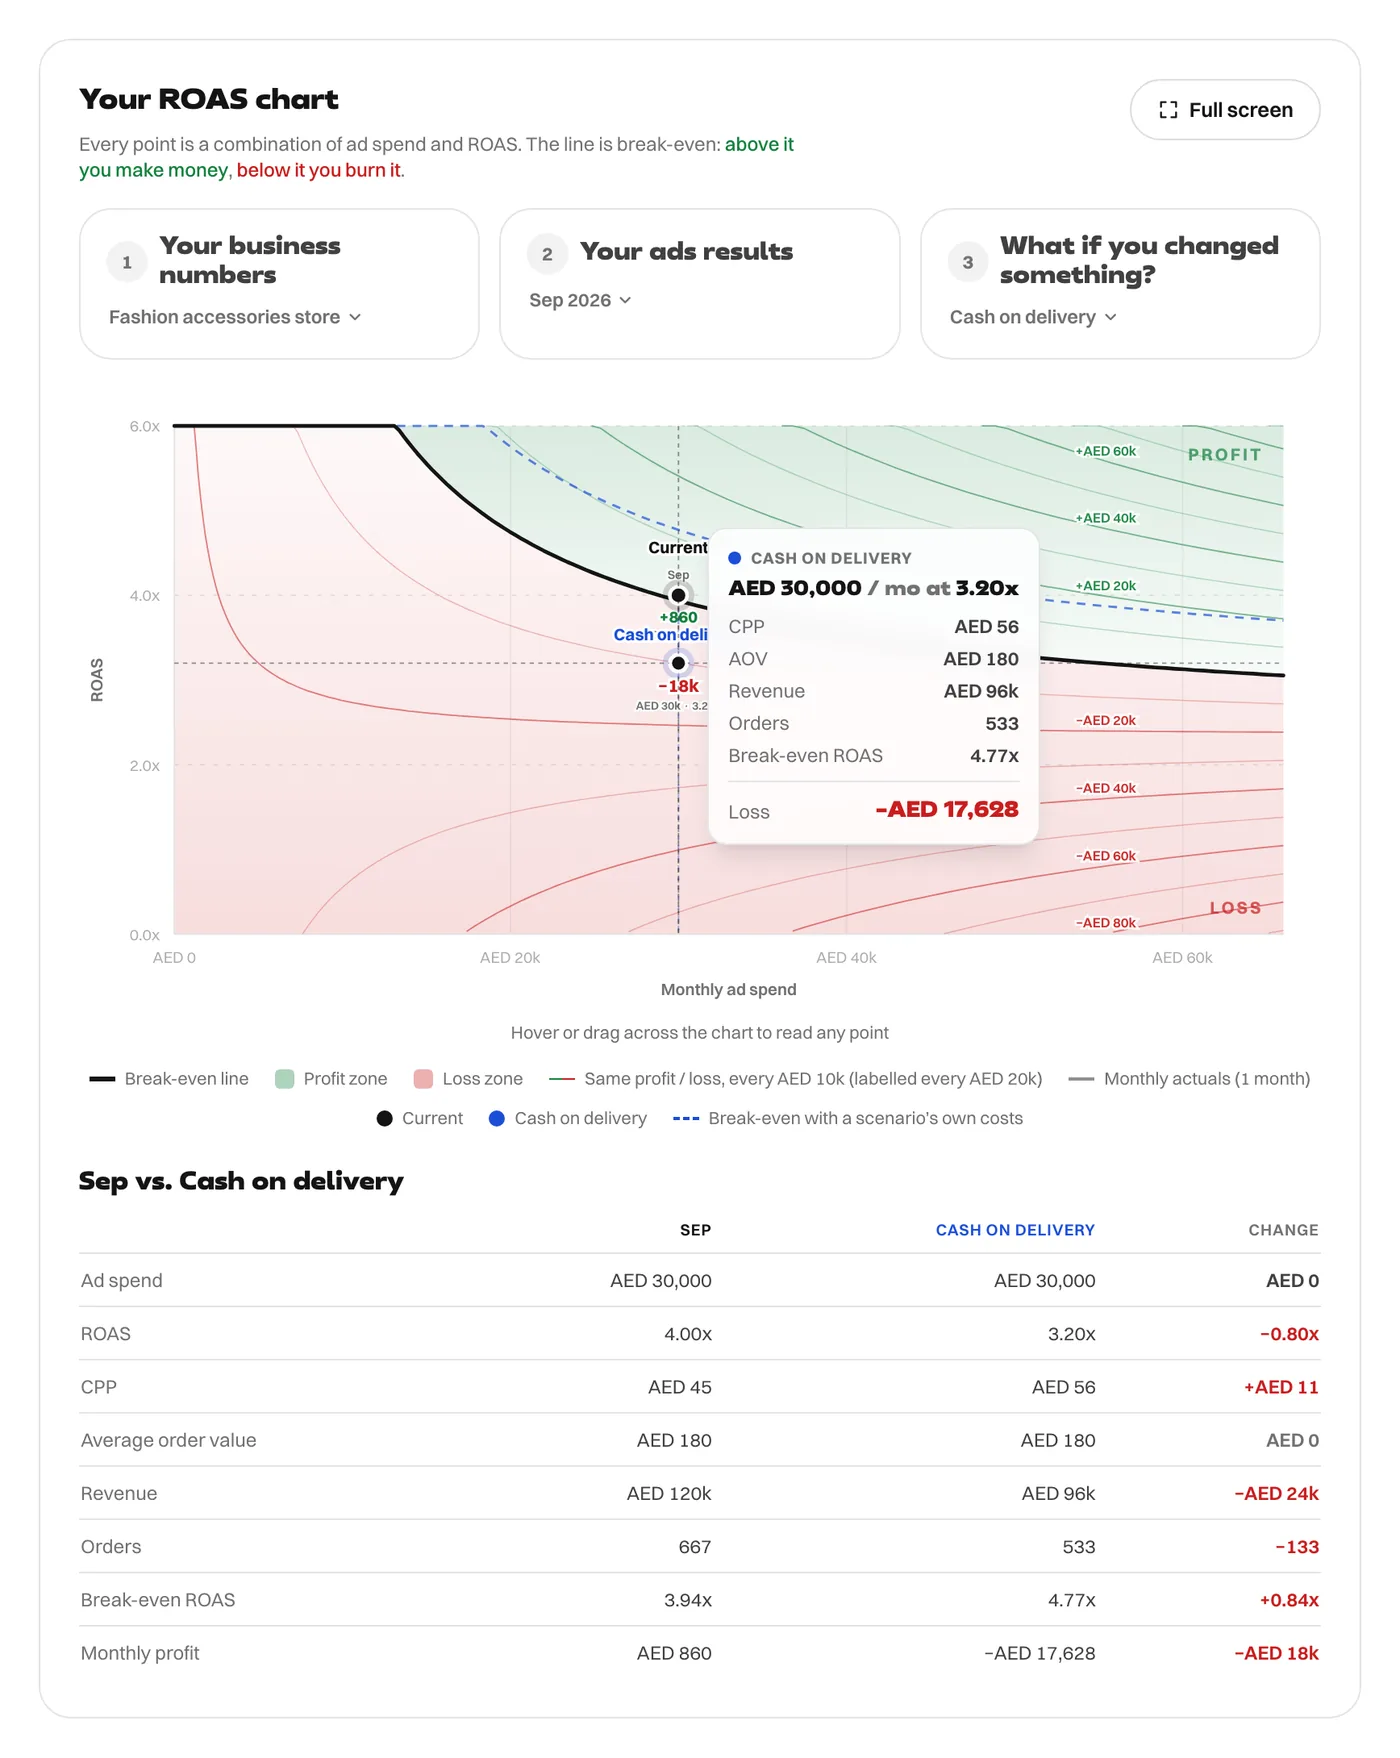
Both things happen at once. Break-even rises from 3.94x to 4.77x, the dashed blue line, because every order costs more to deliver. Real ROAS falls to 3.20x, because a fifth of the revenue never arrives. The month that looked like break-even in Ads Manager actually loses AED 17,628.
These assumptions are illustrative. Your fee, your failure rate and your return costs will be different. But the direction is always the same, and the effect is large even at modest failure rates.
What to measure instead
- Delivered ROAS. Divide the cash you actually collected by the ad spend, not the revenue Meta attributes. Your courier's remittance report has the numbers.
- Your delivery success rate, by product and by city. It is often very different across both.
- Cost per completed order, including failed attempts and return legs.
What to do about it
- Confirm COD orders by WhatsApp or phone before dispatch. Unconfirmed orders are the ones most likely to fail.
- Offer a small discount or free shipping for prepaid orders to move customers onto cards.
- Consider a small deposit for high-value COD orders.
- Pass the COD fee to the customer if your market will accept it.
- Where your ad platform allows it, send back only delivered orders as conversions, so the algorithm optimises for customers who pay.
For how fixed costs shape the line, read the break-even ROAS formula. For the 5% VAT in this example, see VAT on Meta ads in the UAE.
To model COD in the calculator, put your cost per completed order in shipping, set the payment fee for your mix of cash and card, and enter the ROAS you actually collect rather than the one Meta reports.
Every figure in this article comes from the ROAS Chart calculator, and the screenshots show it with the same numbers. The formulas are written out on the math behind it.