· 3 min read · ROAS Chart
How to make your ROAS profitable without touching the ads
Most advice on improving ROAS is about the ads. But a losing ROAS is a gap between two numbers, and the other number, your break-even, is set by things outside the ad account. Move that one and the same ROAS becomes profitable.
Two ways to fix a losing ROAS
When a campaign loses money, the instinct is to fix the ads: new creative, new audiences, a new bid strategy. That is one way to close the gap between your ROAS and your break-even: raise the ROAS.
The other is to lower the break-even. Your break-even ROAS depends on what each order leaves you, and that is decided by your price, your product costs, your shipping and your returns, none of which live in the ad account. Improve any of them and the same ROAS earns more.
A worked example
A tea store sells at an average of $70 with a 55% gross margin. Shipping is $8, payments 3%, and 10% of orders are refunded. Each order leaves $24.55, a contribution margin of 35.1%. Fixed costs are $6,000 a month.
It spends $15,000 a month at 3.60x. Break-even is 3.99x, and the month loses $2,061.
Instead of touching the ads, it makes three changes to the business:
- A bundle that lifts the average order from $70 to $85.
- A better supplier price, raising gross margin from 55% to 58%.
- Clearer product pages and sizing that cut refunds from 10% to 6%.
It assumes the ROAS stays at 3.60x. Here is the result:
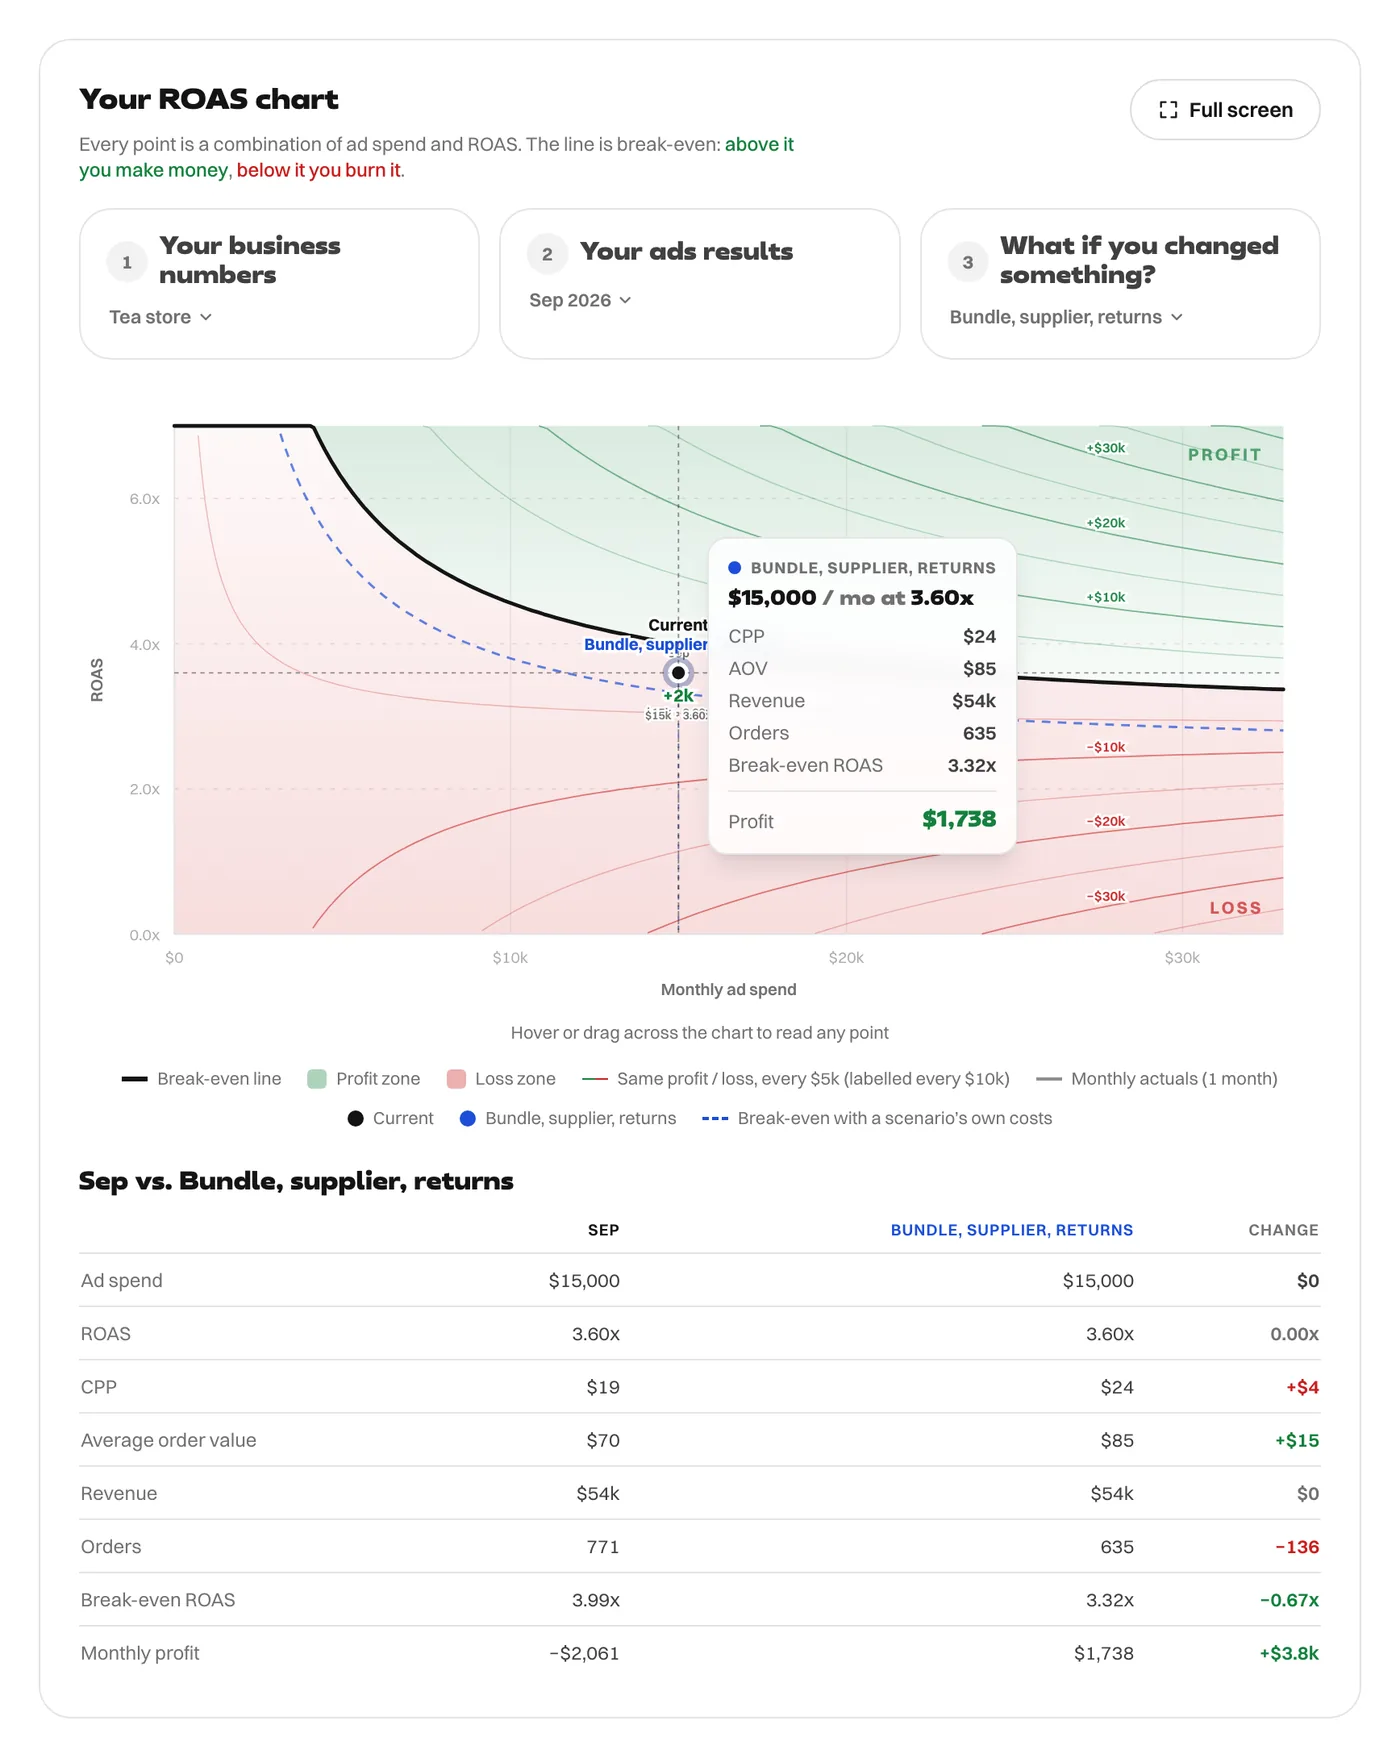
Each order now leaves $35.79, a contribution margin of 42.1%. Break-even drops from 3.99x to 3.32x, and the floor from 2.85x to 2.37x. The month goes from a $2,061 loss to a $1,738 profit, with the same ads, the same spend and the same ROAS.
The levers, roughly in order of impact
- Average order value. Bundles, volume pricing, free-shipping thresholds and add-ons. Fixed costs per order, like shipping, shrink as a share of each sale.
- Product cost. A few points of gross margin carry straight through to contribution.
- Returns and refunds. Better photos, sizing guides and descriptions. Each refund costs you the margin on the order.
- Shipping and fulfilment. Carrier rates, packaging, and whether you or the customer pays.
- Fees. Payment fees, app subscriptions, agency fees on spend.
A caution about the assumption
This example holds ROAS constant. In practice changes to price and offer affect conversion rate too, in either direction. A bundle might convert better or worse than the single product. Test each change, and put the ROAS you actually observe back into your numbers.
The point stands, though: the ads are only half of whether ads are profitable. For the effect of each lever on its own, see contribution margin vs gross margin. For VAT and agency fees, see what a media-buying fee does to break-even.
In the calculator, add a scenario with the new numbers. The chart draws its own break-even line next to your current one, and a table shows the change in profit.
Every figure in this article comes from the ROAS Chart calculator, and the screenshots show it with the same numbers. The formulas are written out on the math behind it.