· 3 min read · Amir Emad
Contribution margin vs gross margin: which one sets your ROAS target
Ask a store owner for their margin and they will usually give you their gross margin. For deciding what ROAS you need, it is the wrong number, and it always errs in the dangerous direction.
Two margins, two different questions
Gross margin is what is left after the cost of the goods: order value minus product cost, divided by order value. It is what most suppliers, spreadsheets and accountants quote.
Contribution margin goes further. It also takes off every other cost that comes with an order: shipping and packaging, payment fees, the margin lost on refunds, and any per-order fees from marketplaces or apps.
Contribution margin = (order value − product cost − shipping − payment fee − refund losses) ÷ order value
For advertising, contribution margin is the one that matters. An ad's job is to produce orders, and every one of those costs is paid on every order the ad produces.
How far apart they are
A pet supplies store has a $80 average order and a 60% gross margin, so the product costs $32. Then:
| Per order | Amount |
|---|---|
| Order value | $80.00 |
| Product cost | −$32.00 |
| Gross profit (60%) | $48.00 |
| Shipping | −$9.00 |
| Payment fee (3%) | −$2.40 |
| Refunds (8% of orders) | −$3.84 |
| Contribution | $32.76 |
Gross margin says the store keeps 60% of each sale. It actually keeps 40.9%. That gap is a third of the margin.
What that does to break-even ROAS
Use gross margin in the simple formula and break-even looks like 1 ÷ 0.60 = 1.67x. Use contribution margin and the floor is 2.44x.
The store is currently spending $15,000 a month at 2.20x ROAS. Against the gross-margin number, 2.2x looks safe, a good way above 1.67x. Here it is against its real costs, with $6,000 a month of fixed costs included:
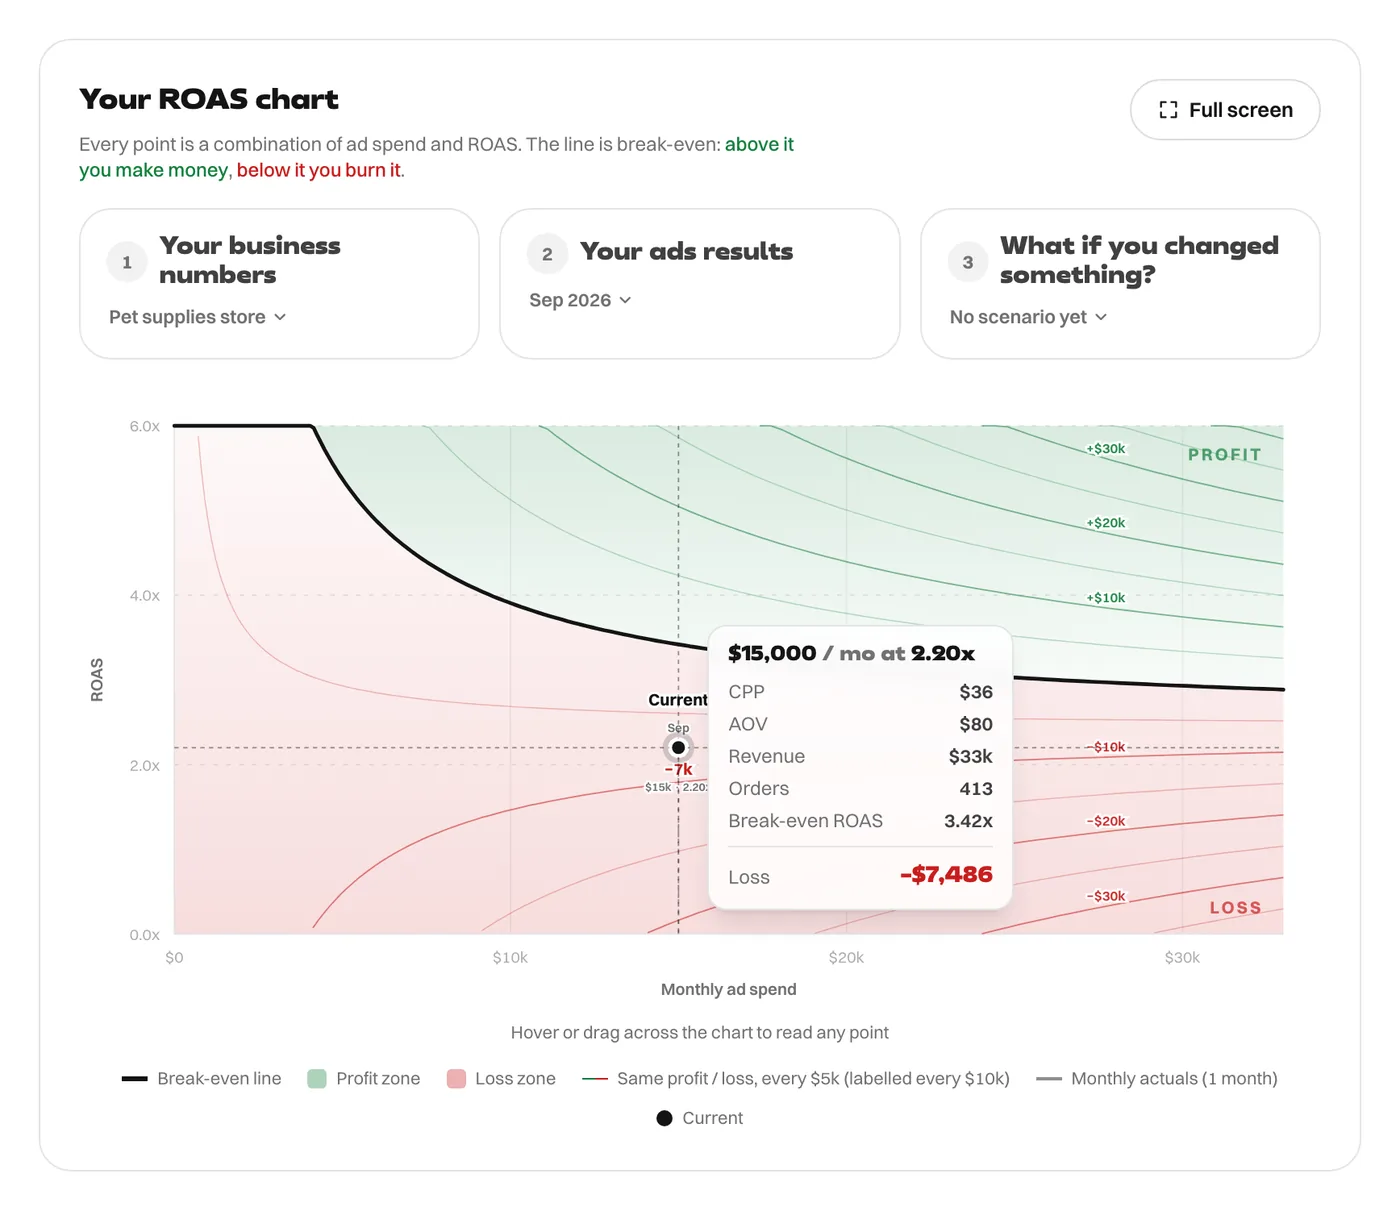
The month loses $7,486. And because 2.20x is below the 2.44x floor, it would lose money at any budget: break-even is still 2.52x at $200,000 a month. Someone reading the gross margin would scale this campaign. The contribution margin says to stop.
Where contribution margin leaks
If your contribution margin is much lower than your gross margin, these are the usual places to look:
- Shipping on small orders. A fixed $9 shipping cost is 11% of an $80 order. On a $160 order it would be about 6%.
- Returns. A refund costs you the margin on the order, and often return shipping as well.
- Payment and app fees. Each one looks small. Together they add up.
Each of these affects your break-even ROAS as much as your ads do. Improving any of them lowers the line on the chart for every campaign you run.
Using it
Work out contribution per order once, from your real invoices, and use it everywhere you talk about ROAS. It is the input to the break-even ROAS formula, to break-even cost per purchase, and to your minimum ROAS.
Every figure in this article comes from the ROAS Chart calculator, and the screenshots show it with the same numbers. The formulas are written out on the math behind it.