· 3 min read · ROAS Chart
Blended ROAS: what it tells you, and what it hides
Blended ROAS rolls every channel into one number. That is its strength and its weakness: a single healthy average can contain one channel that loses money on every order it wins.
What blended ROAS is
Blended ROAS is your total revenue from ads divided by your total ad spend across every channel. If Meta brought in $64,800 on $18,000 and Google $12,600 on $7,000, your blended ROAS is $77,400 ÷ $25,000 = 3.10x.
It is useful because it is simple, and because it avoids one channel's numbers looking better than they are. But it is an average, and averages can hide things.
What it can hide
In that example, Meta returned 3.60x and Google 1.80x. The blended 3.10x sounds like a reasonable month. Whether it is depends on where the two channels sit against your break-even.
The store sells baby products at an average of $85, with a 60% gross margin. After $8 shipping, 3% payment fees and 5% refunds, each order leaves $37.90, a contribution margin of 44.6%. That puts its floor at 2.24x. Fixed costs are $12,000 a month.
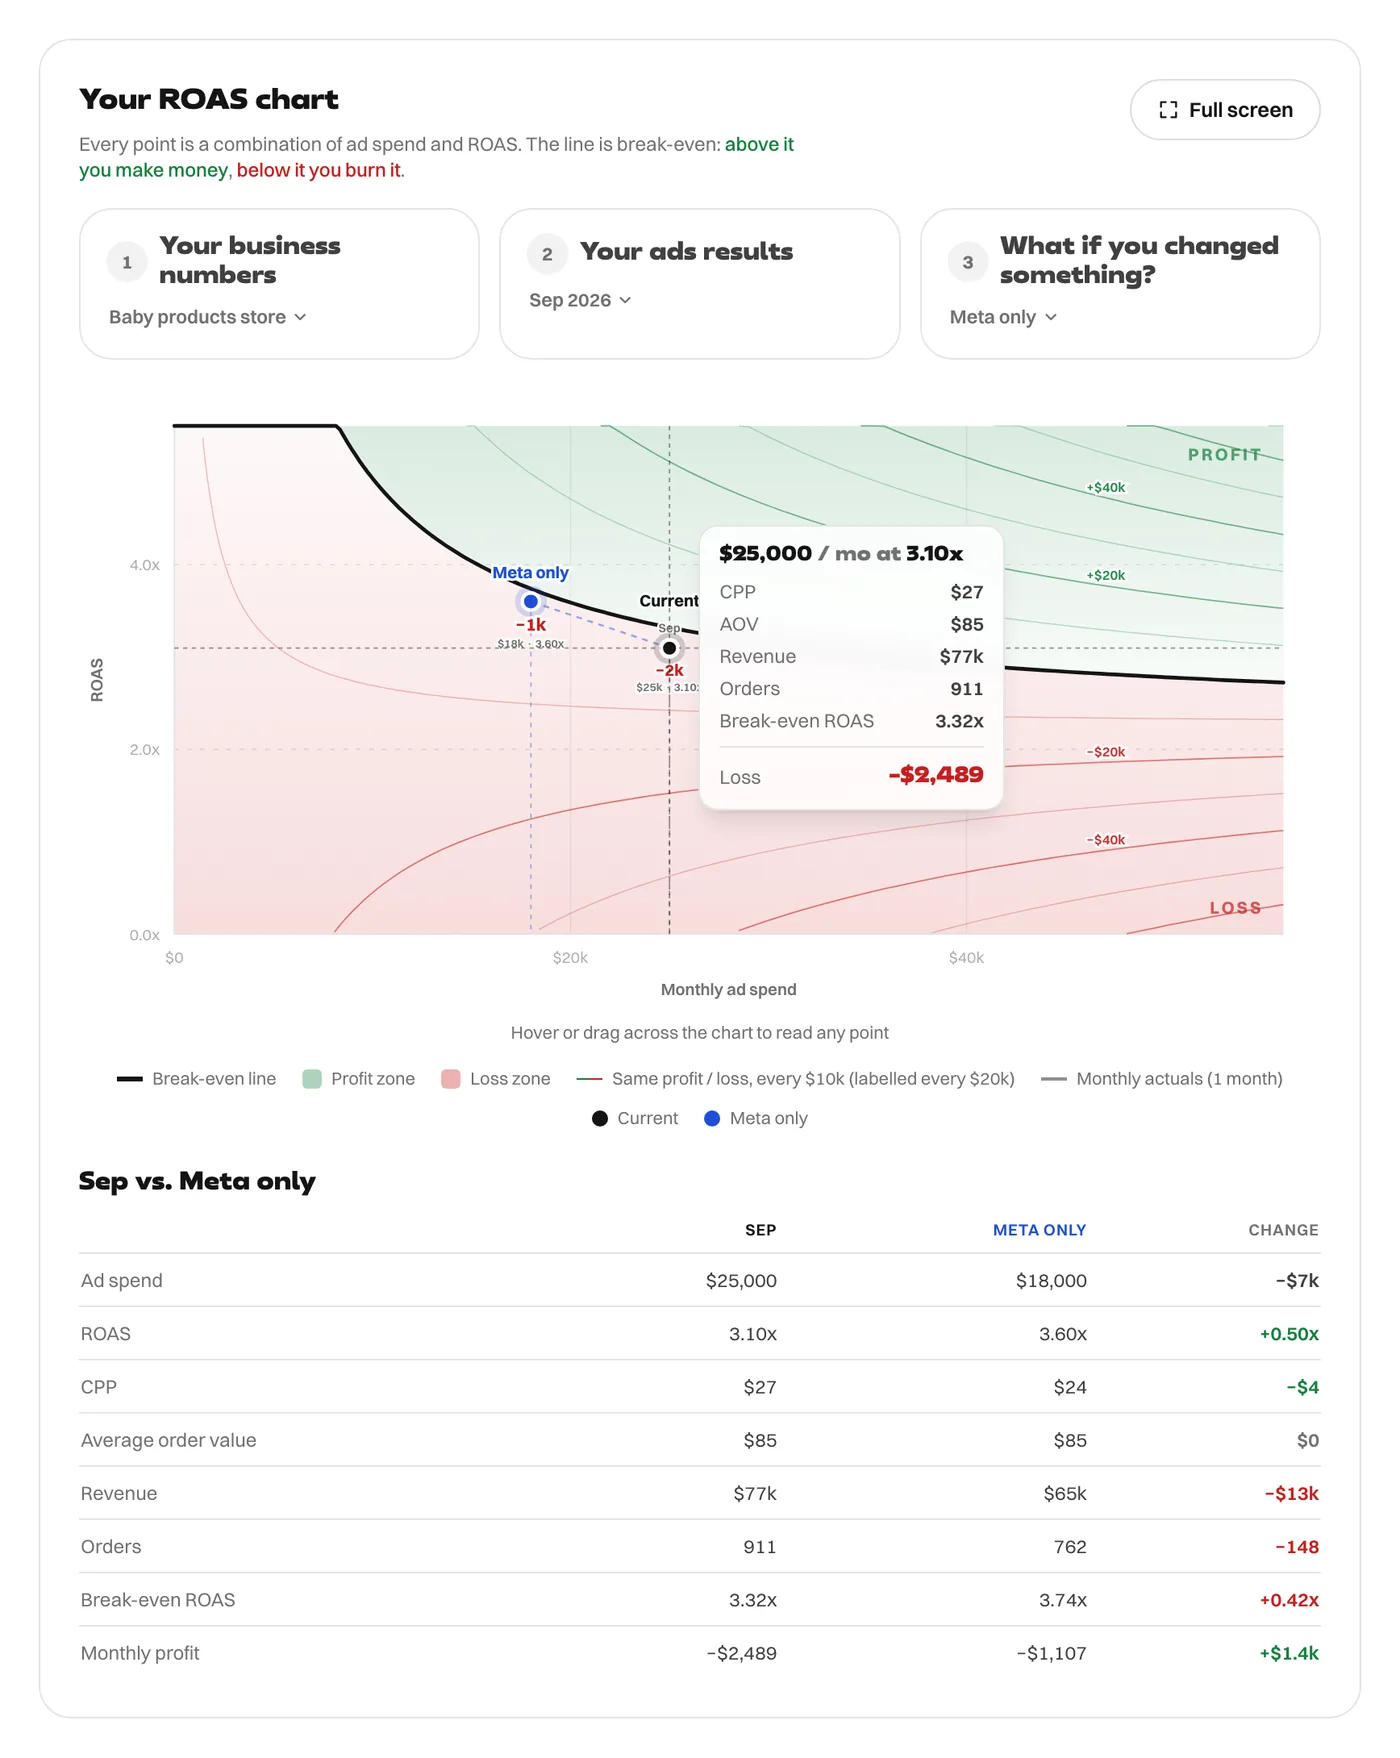
The blended month loses $2,489. Now look at Google on its own. Its 1.80x is below the 2.24x floor. Every dollar spent there lost money before a single fixed cost was paid. The Google spend of $7,000 brought in $12,600 of sales, which left $5,618 of contribution: a loss of $1,382 on that channel alone.
With Meta alone, the month would have lost $1,107 instead of $2,489. Dropping the channel below the floor improves the month by $1,382. The blended number hid all of that.
Meta alone is not profitable yet either: at $18,000 a month, break-even is 3.74x. That is a fixed-cost problem, solvable with more volume at a good ROAS, which is a different problem from a channel that loses money on every order.
A caution about cutting channels
This assumes Google's sales would disappear without Google. That is not always true: some of those buyers may have come anyway, or been nudged by a Meta ad first. Before you cut a channel, test it. Pause it, or cut it back, for a few weeks and watch your total revenue, not the platform reports.
How to use blended ROAS properly
- Track blended ROAS, or MER, for the business as a whole. It tells you whether the month works.
- Break it down by channel, and compare each one with your floor (here is how to find it). A channel below the floor is losing money on every order.
- Test the losing channel before cutting it, by pausing it and watching total revenue.
- Put the budget where each extra dollar returns the most.
For the difference between blended ROAS and MER, see MER vs ROAS.
Every figure in this article comes from the ROAS Chart calculator, and the screenshots show it with the same numbers. The formulas are written out on the math behind it.