· 3 min read · ROAS Chart
MER vs ROAS: which number should run your store?
Your ad platforms say one thing and your bank balance says another. The marketing efficiency ratio, MER, is how you find out which to believe, and it takes thirty seconds to calculate.
Two ways to measure the same month
ROAS, as the ad platforms report it, is the revenue each platform attributes to its own ads, divided by what you spent on that platform.
MER, the marketing efficiency ratio, is all your store's revenue divided by all your ad spend:
MER = total store revenue ÷ total ad spend
Some people call MER "blended ROAS". The idea is the same: stop asking each platform to grade its own homework, and look at what the business actually took in.
Why platform ROAS and MER disagree
Each platform counts a sale as its own if one of its ads was involved within its attribution window. A customer who clicks a Meta ad on Monday, searches your brand on Google on Wednesday and buys can be counted by both. Add the platforms' numbers together and you can end up with more revenue than you sold.
The gap can go the other way too. MER includes sales from email, organic search and returning customers who saw no ad at all, which can make it higher than any single platform's ROAS. Which direction matters less than the principle: your costs are paid out of the revenue that reached your bank account, so that is the revenue your break-even should be measured against.
A worked example
A haircare store spends $30,000 a month across Meta and Google. Add up what the two platforms claim and it comes to $102,000 of revenue, a ROAS of 3.40x. The store's own sales for the month were $78,000. That is an MER of 2.60x.
Its numbers: average order $75, 65% gross margin, $7 shipping, 3% payment fees and 5% refunds, which leaves $37.06 per order, a contribution margin of 49.4%. Fixed costs are $14,000 a month.
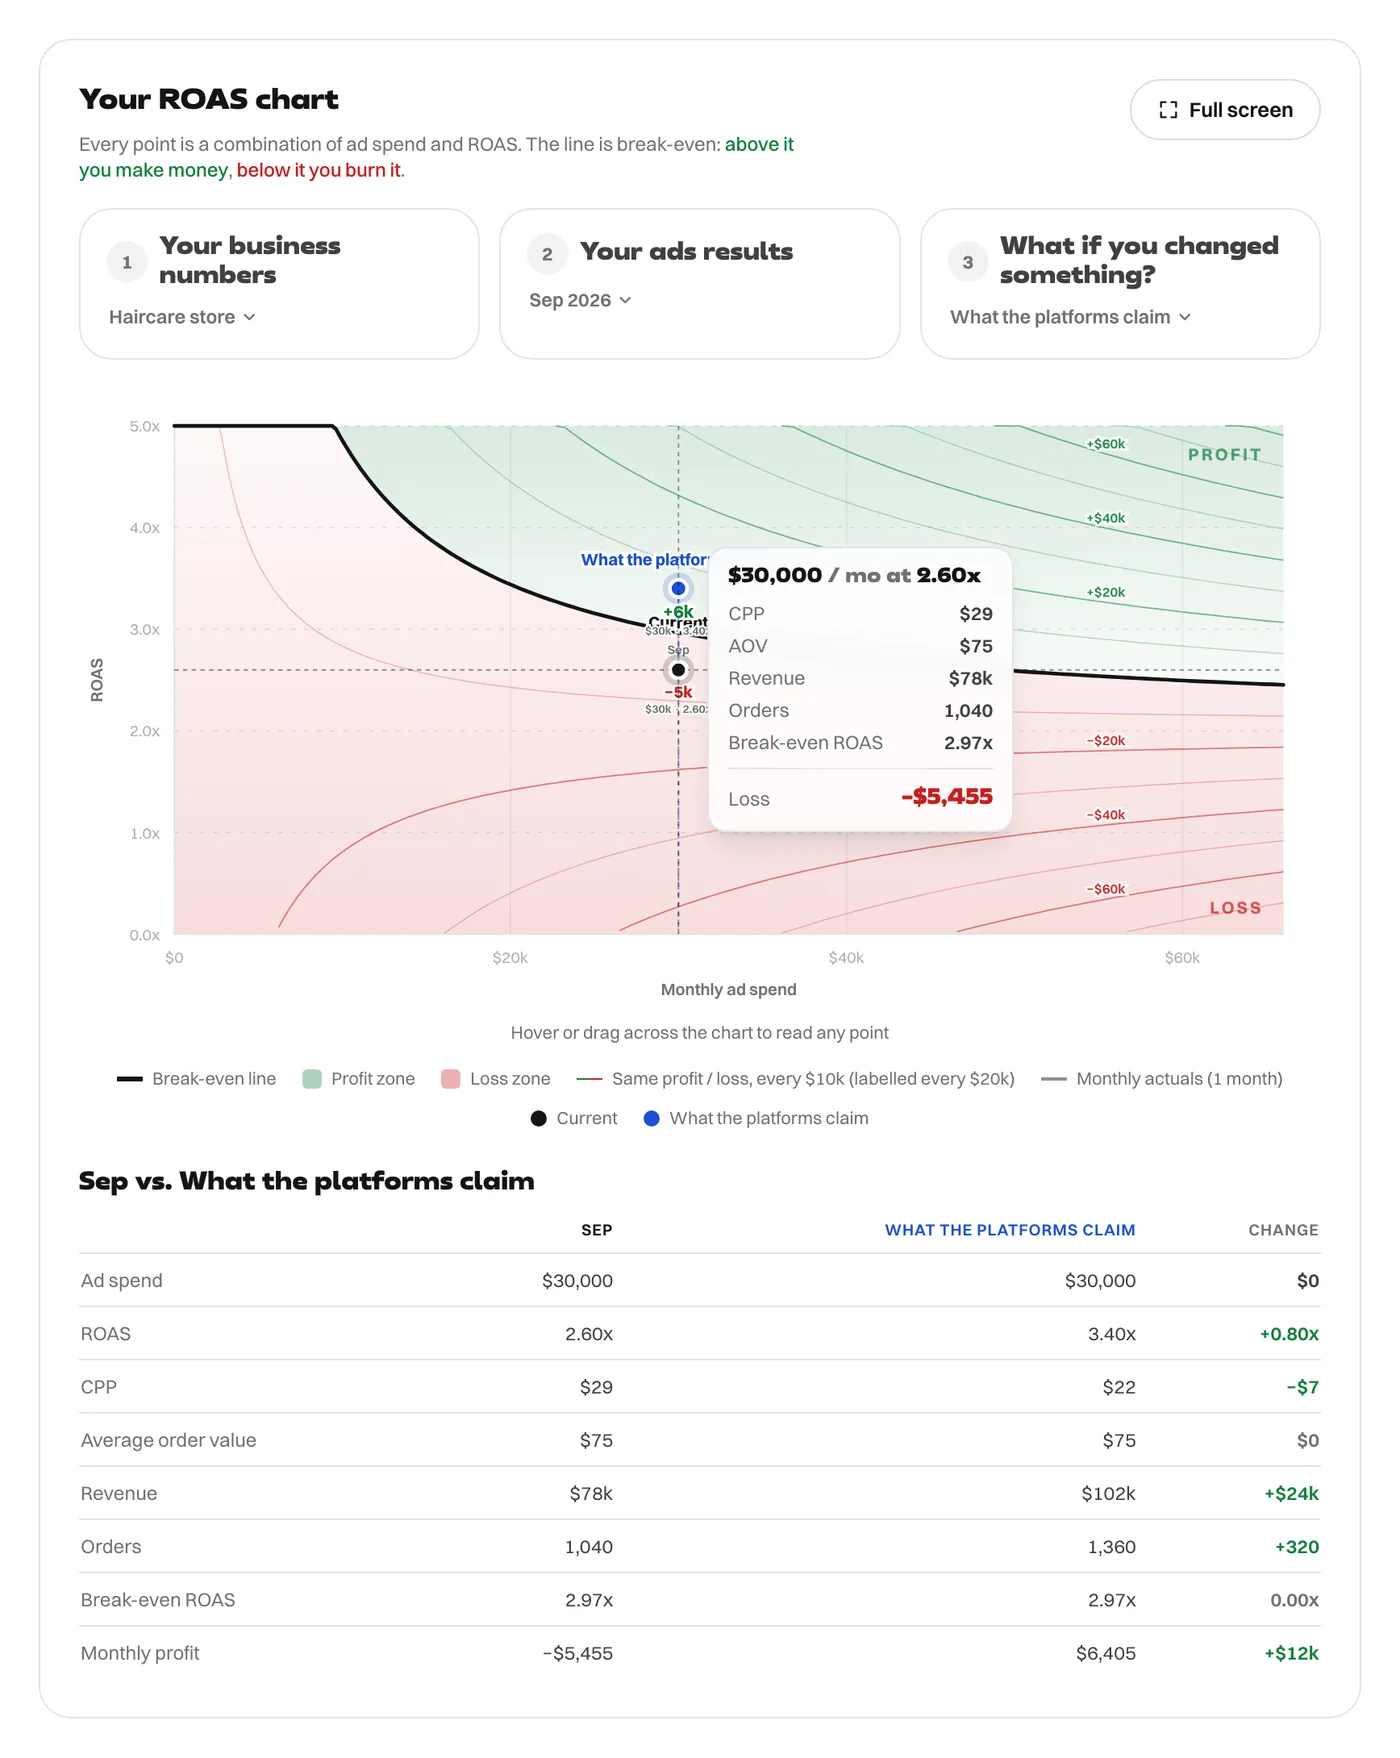
Break-even at $30,000 a month is 2.97x. On the platforms' numbers, the month made $6,405. On the store's actual revenue, it lost $5,455. Both points use the same costs. Only one of them describes money that exists.
When to use each
- Use MER for the big decisions: total budget, whether the business is profitable, whether to scale overall. It cannot be double-counted and it ties to your accounts.
- Use platform ROAS for the small decisions: which campaign, ad set or creative is doing better than another within a platform. For ranking things against each other, its biases matter less.
- Compare both against the same break-even. Plot your MER against your break-even line each month. If the platforms' ROAS says profit and your MER says loss, believe the MER.
A simple monthly routine
- Take total revenue from your store, net of refunds, for the month.
- Take total ad spend across every platform, including any VAT you cannot recover.
- Divide the first by the second. That is your MER. Plot it against your break-even at that spend. Here is how to calculate break-even with fixed costs.
- Watch the gap between the platforms' ROAS and your MER. If it widens, attribution is getting more generous, not your ads better.
A related trap is looking at one blended number that hides a channel losing money. For store owners who take cash on delivery, reported ROAS can also include orders that are never paid for: see cash on delivery and break-even ROAS.
Every figure in this article comes from the ROAS Chart calculator, and the screenshots show it with the same numbers. The formulas are written out on the math behind it.