· 3 min read · ROAS Chart
The break-even sales formula in Google Sheets or Excel
If you would rather build it yourself, here is a complete break-even ROAS calculator in six spreadsheet formulas, fixed costs included. It works in Google Sheets and Excel, with example numbers so you can check your work.
Set up the inputs
Put your numbers in column B, one per row, starting in row 2. Enter percentages as percentages (52%, not 52), so the spreadsheet stores them as decimals. Here is an example for a bedding store:
| Cell | Input | Example |
|---|---|---|
| B2 | Average order value | $130 |
| B3 | Gross margin | 52% |
| B4 | Shipping per order | $11 |
| B5 | Payment fee | 3% |
| B6 | Refund rate | 5% |
| B7 | Fixed costs per month | $16,000 |
| B8 | Fees on ad spend (agency, VAT) | 0% |
| B9 | Monthly ad spend | $30,000 |
| B10 | ROAS | 4.2 |
The formulas
These work the same in Google Sheets and Excel. Put them in column B, below the inputs.
| Cell | What it calculates | Formula |
|---|---|---|
| B12 | Contribution per order | =B2*B3 - B2*B3*B6 - B4 - B2*B5 |
| B13 | Contribution margin | =B12/B2 |
| B14 | Floor (lowest ROAS that can ever break even) | =(1+B8)/B13 |
| B15 | Break-even ROAS at your spend | =(B9*(1+B8)+B7)/(B9*B13) |
| B16 | Monthly profit at your ROAS | =B9*B10*B13 - B9*(1+B8) - B7 |
| B17 | Break-even cost per purchase | =B2/B15 |
What each one does:
- B12 starts from the order value, keeps the gross margin, takes off the margin lost on refunded orders (refund rate × gross profit), then shipping and the payment fee.
- B14, the floor, is the break-even ROAS with an unlimited budget. Below it, every order loses money.
- B15 is the one that matters month to month. It includes your fixed costs, so it changes with your ad spend.
- B16 is the profit for the month at the ROAS in B10.
Check your sheet against the calculator
With the example inputs, your sheet should show:
| Cell | Result |
|---|---|
| B12 Contribution per order | $49.32 |
| B13 Contribution margin | 37.9% |
| B14 Floor | 2.64x |
| B15 Break-even ROAS | 4.04x |
| B16 Monthly profit | $1,802 |
| B17 Break-even CPA | $32.17 |
Here are the same inputs in the ROAS Chart calculator:
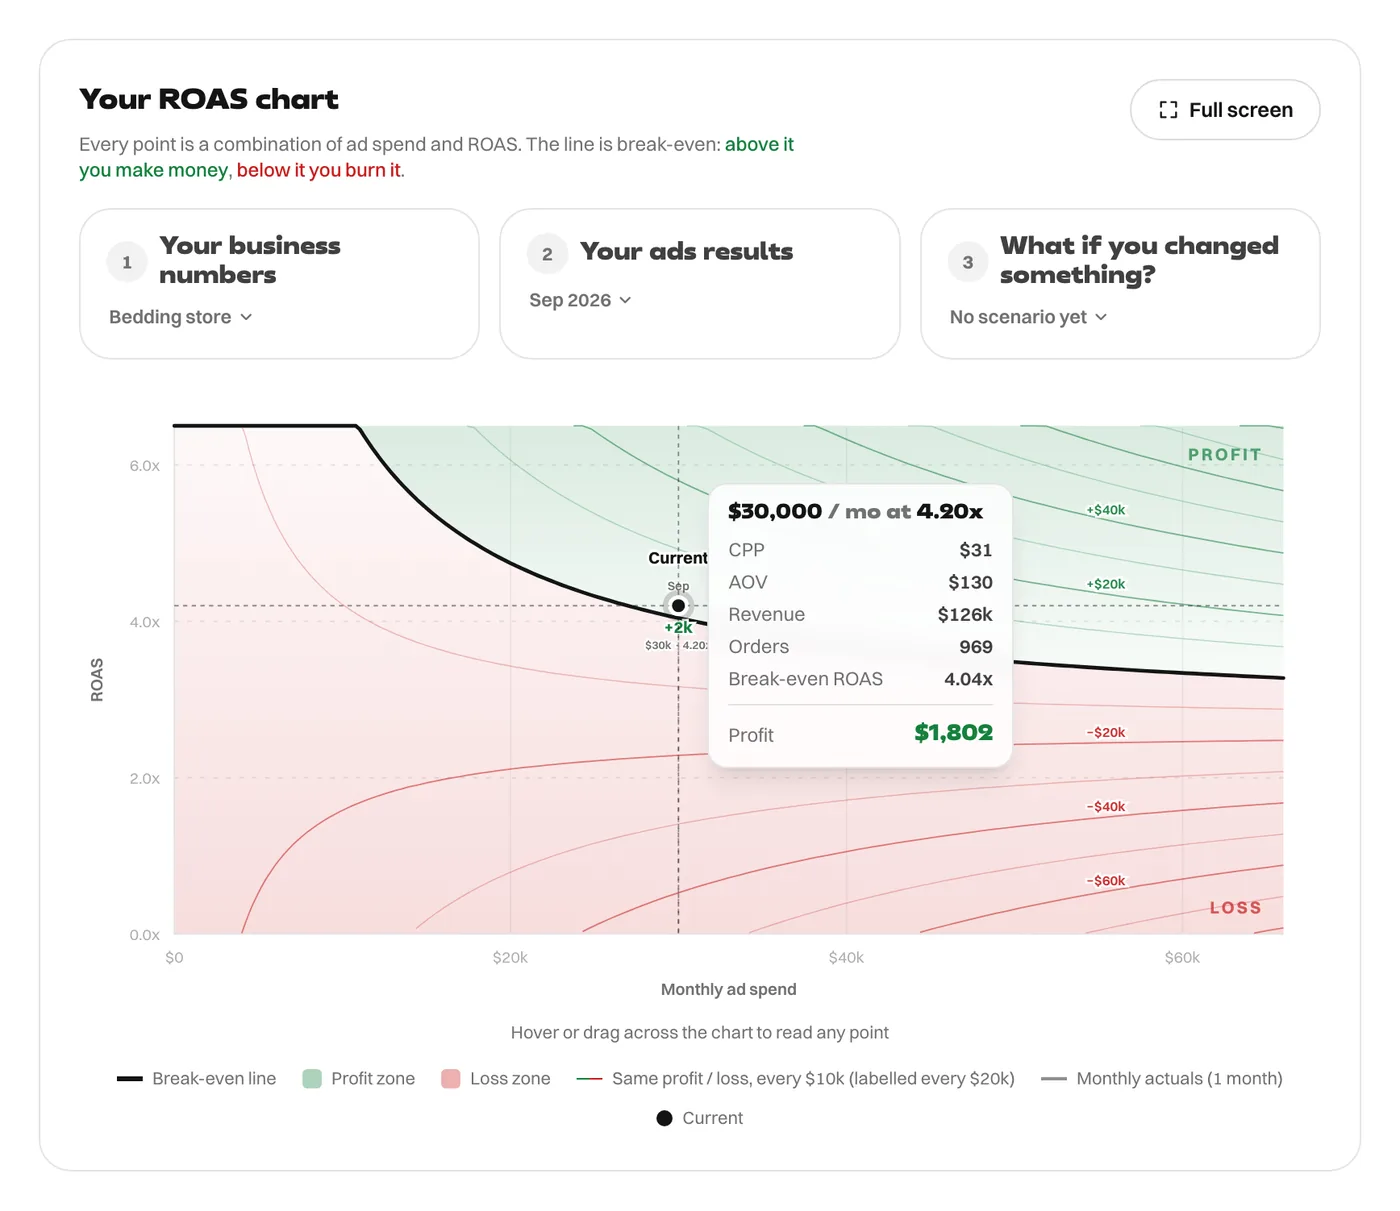
If your numbers differ, check that percentages were entered with the % sign, and that fixed costs are monthly.
Make it a table across spend levels
Because break-even changes with spend, it is worth seeing several budgets at once. Put spend levels in a column, say D2:D6, and in E2:
=($D2*(1+$B$8)+$B$7)/($D2*$B$13)
Fill it down. For the example store:
| Monthly spend | Break-even ROAS |
|---|---|
| $15,000 | 5.45x |
| $30,000 | 4.04x |
| $60,000 | 3.34x |
When a spreadsheet is enough, and when it isn't
A sheet is great for one set of numbers. It gets harder when you want to track every month, compare a what-if scenario, or see where each month sits against the curve. That is what the calculator's chart is for. It draws the whole line, plots your months on it and compares scenarios side by side, with the same formulas.
For what each formula means, see the break-even ROAS formula and minimum ROAS.
Every figure in this article comes from the ROAS Chart calculator, and the screenshots show it with the same numbers. The formulas are written out on the math behind it.