· 4 min read · Amir Emad
Did that change make more profit, or just a higher ROAS?
You changed something last month. The ROAS went up. The question nobody asks next is whether the bank balance went up with it, and the answer is no more often than you would think.
The short answer
ROAS is a ratio and profit is an amount. A change can lift the ratio and shrink the amount, and the most common way to do it is the one that feels most responsible: spending less.
Fixed costs are the reason. They sit there whatever you spend, so the more revenue you spread them across, the less each order has to carry. Cut the budget and every remaining order carries more.
Same store, two months
A store with an average order of $90 and high margins: 88% gross margin, $2 shipping, 2.9% payment fees, 2% refunds. About $73 of each order survives, which is 81% of the sale. Fixed costs are $5,000 a month.
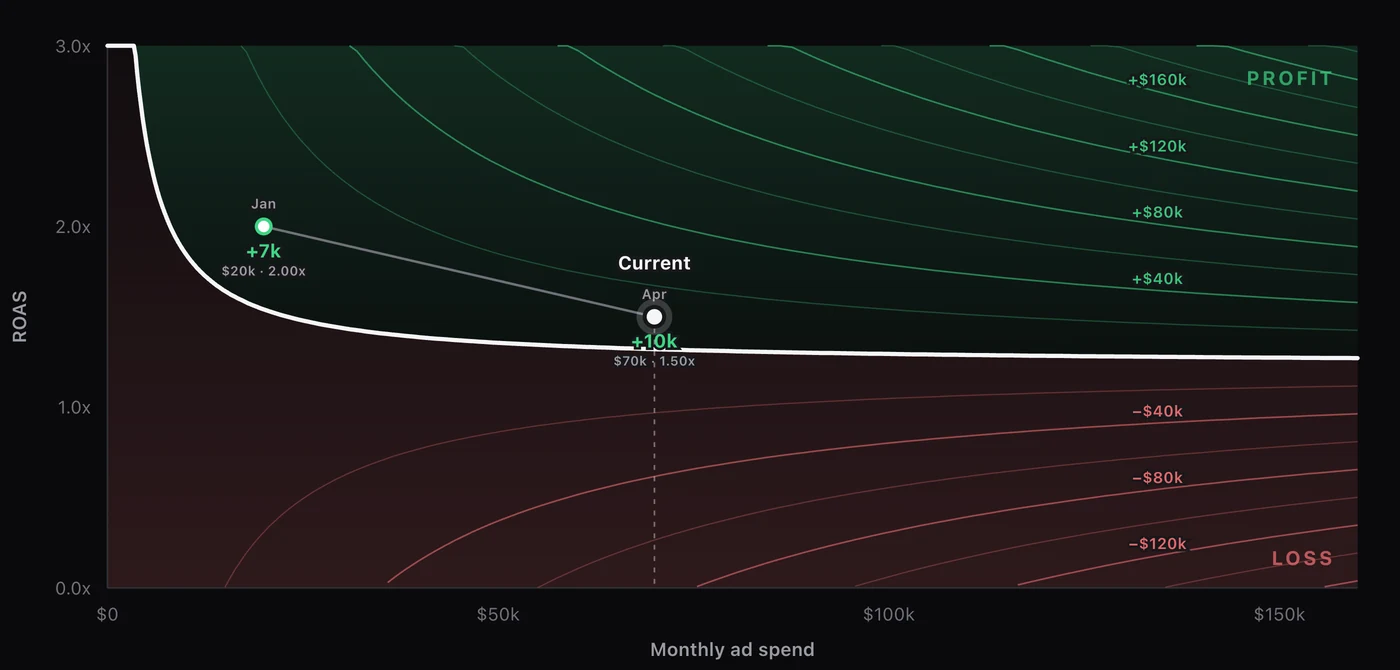
January spent $20,000 and hit 2.00x, which made $7,447. April spent $70,000 and hit 1.50x, which made $10,174.
April has the worse ROAS and $2,727 more profit. If you judged those two months by the dashboard you would cut April and keep January, and be $2,727 a month poorer for it.
The reason is on the chart. Break-even at $20,000 is 1.54x, and at $70,000 it is 1.32x, because the same $5,000 of overhead is spread across three and a half times the revenue. April cleared its line by more than January cleared its own.
Changes that flatter ROAS
These usually raise the ratio and lower the amount:
- Cutting spend. The clearest case, and the one above.
- Turning off your worst-performing audience. Average ROAS rises. If that audience was above break-even, profit falls.
- Leaning harder on retargeting and brand search. Cheap conversions that were often going to happen anyway lift the reported number without adding orders.
Changes that raise profit and leave ROAS flat
And these do the opposite, which is why they get abandoned too early:
- Raising the average order value. Bundles and thresholds spread your per-order costs across more revenue. ROAS may not move at all while every order is worth more.
- Cutting product or shipping cost. Nothing in the ad account changes. Your break-even line drops, so the same ROAS is worth more.
- Reducing refunds. Same ads, same ROAS, more of the revenue kept. Sizing guides and better photography are media buying, in the only sense that matters.
These levers all move the same underlying quantity, your contribution margin, and none of them touch the number Meta reports.
How to check before you commit
Ask two questions of any change, in this order.
Does it move my break-even line, or my position against it? Cheaper shipping moves the line. A better creative moves your position. Both are worth doing; only one survives a bad month.
At the budget I actually plan to run, what does the month make? Not at last month’s budget, at next month’s. Break-even falls as you spend more, so the answer changes with the number you were going to decide last.
If a change makes more money at a lower ROAS, take the money. The ratio is a diagnostic, not the goal.
Every figure in this article comes from the ROAS Chart calculator, and the screenshots show it with the same numbers. The formulas are written out on the math behind it.