· 3 min read · ROAS Chart
How much should you spend on Facebook ads?
There is a budget below which your Facebook ads cannot make money, even if every campaign hits its ROAS. It is set by your fixed costs, and you can work it out in a few minutes.
Start from break-even, not from a benchmark
Most advice on Facebook ad budgets gives you a daily number: $20 to test, $50 an ad set, and so on. Those numbers are about getting enough data for the algorithm to learn. They say nothing about whether the budget can make money.
For that, the question to ask is: at the ROAS I can realistically get, how much do I need to spend for the month to cover my fixed costs?
Every month you pay salaries, software and rent whether or not you advertise. The contribution from your ad sales has to cover those first. At a given ROAS, each dollar of ad spend contributes a fixed amount toward them, so there is a minimum spend below which the month cannot break even:
Minimum spend = fixed costs ÷ (ROAS × contribution margin − (1 + fees on spend))
A worked example
A jewelry store sells at an average of $65 with a 65% gross margin. After $6 shipping, 3% payment fees and 4% refunds, each order leaves $32.61, a contribution margin of 50.2%. Its fixed costs are $9,000 a month.
It currently spends $10,000 a month and gets 3.00x:
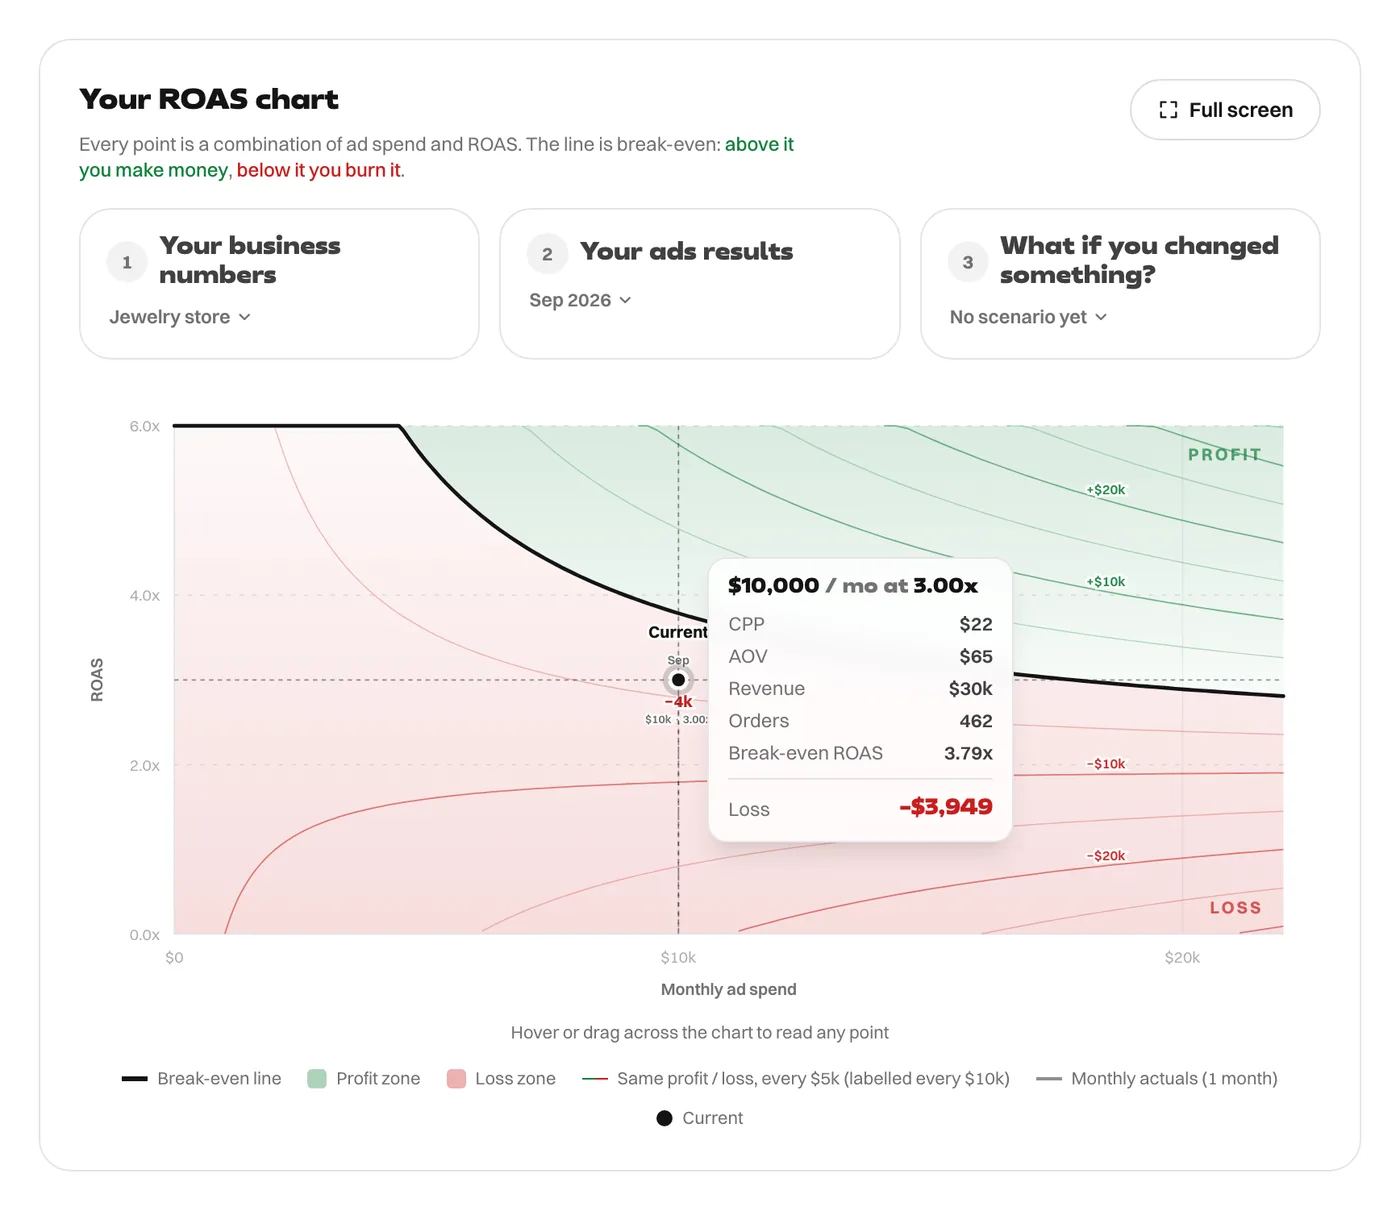
At $10,000, break-even is 3.79x and the month loses $3,949. The budget is too small to carry the fixed costs at this ROAS.
How much it needs to spend
Here is the minimum monthly spend at different ROAS levels, and what that works out to per day:
| If you get | Minimum monthly spend | Per day |
|---|---|---|
| 2.50x | $35,401 | $1,180 |
| 3.00x | $17,819 | $594 |
| 3.50x | $11,906 | $397 |
| 4.00x | $8,939 | $298 |
If the store can hold 3x, it needs about $17,819 a month, around $594 a day, just to break even. Here is what 3x earns at higher budgets:
| Monthly spend at 3.00x | Break-even ROAS | Monthly profit |
|---|---|---|
| $10,000 | 3.79x | −$3,949 |
| $20,000 | 2.89x | $1,102 |
| $30,000 | 2.59x | $6,152 |
| $40,000 | 2.44x | $11,203 |
The catch: ROAS will not stay put
The tables assume ROAS holds as spend grows. It usually doesn't: more budget reaches less eager buyers. So use them the other way around. Decide the budget you want to run, estimate the ROAS you would realistically get there, and check that it clears break-even at that budget.
If the ROAS you can get is below your floor, 1 ÷ contribution margin (here 1.99x), no budget works. If it is above the floor, there is a budget that works, and the table tells you roughly where it starts. For how to judge each step up, see why ROAS drops when you scale.
And what if you can't afford that budget?
Then the lever is not the ads. Lower the fixed costs, or raise the contribution per order, and the minimum spend falls with them. A store with $4,500 of fixed costs would need half the budget at every ROAS. For where contribution usually leaks, see contribution margin vs gross margin.
Every figure in this article comes from the ROAS Chart calculator, and the screenshots show it with the same numbers. The formulas are written out on the math behind it.