· 3 min read · ROAS Chart
How to increase average order value, and what it does to your break-even ROAS
Average order value sounds like a sales metric. It is also one of the biggest levers on the ROAS you need to break even, because some of your costs are charged per order, not per dollar.
Why order value moves break-even at all
If every cost of an order were a percentage of its price, average order value (AOV) would not matter to your break-even ROAS. A 60% margin is a 60% margin at any price.
But some costs are fixed per order. Shipping and packaging cost roughly the same whether the customer buys one notebook or five. Spread over a bigger order, those costs take a smaller share of the sale, so more of each dollar of revenue is left to pay for the ads.
A worked example
A stationery store sells at an average of $45 with a 60% gross margin. Shipping costs $7, 16% of the average order. Payments take 3% and refunds 4%. Each order leaves $17.57, a contribution margin of 39.0%. Fixed costs are $4,000 a month.
It spends $12,000 a month at 3.30x. Break-even is 3.41x, and the month loses $538.
It introduces bundles and a free-shipping threshold, and the average order rises to $60. Here is the same month with the new AOV:
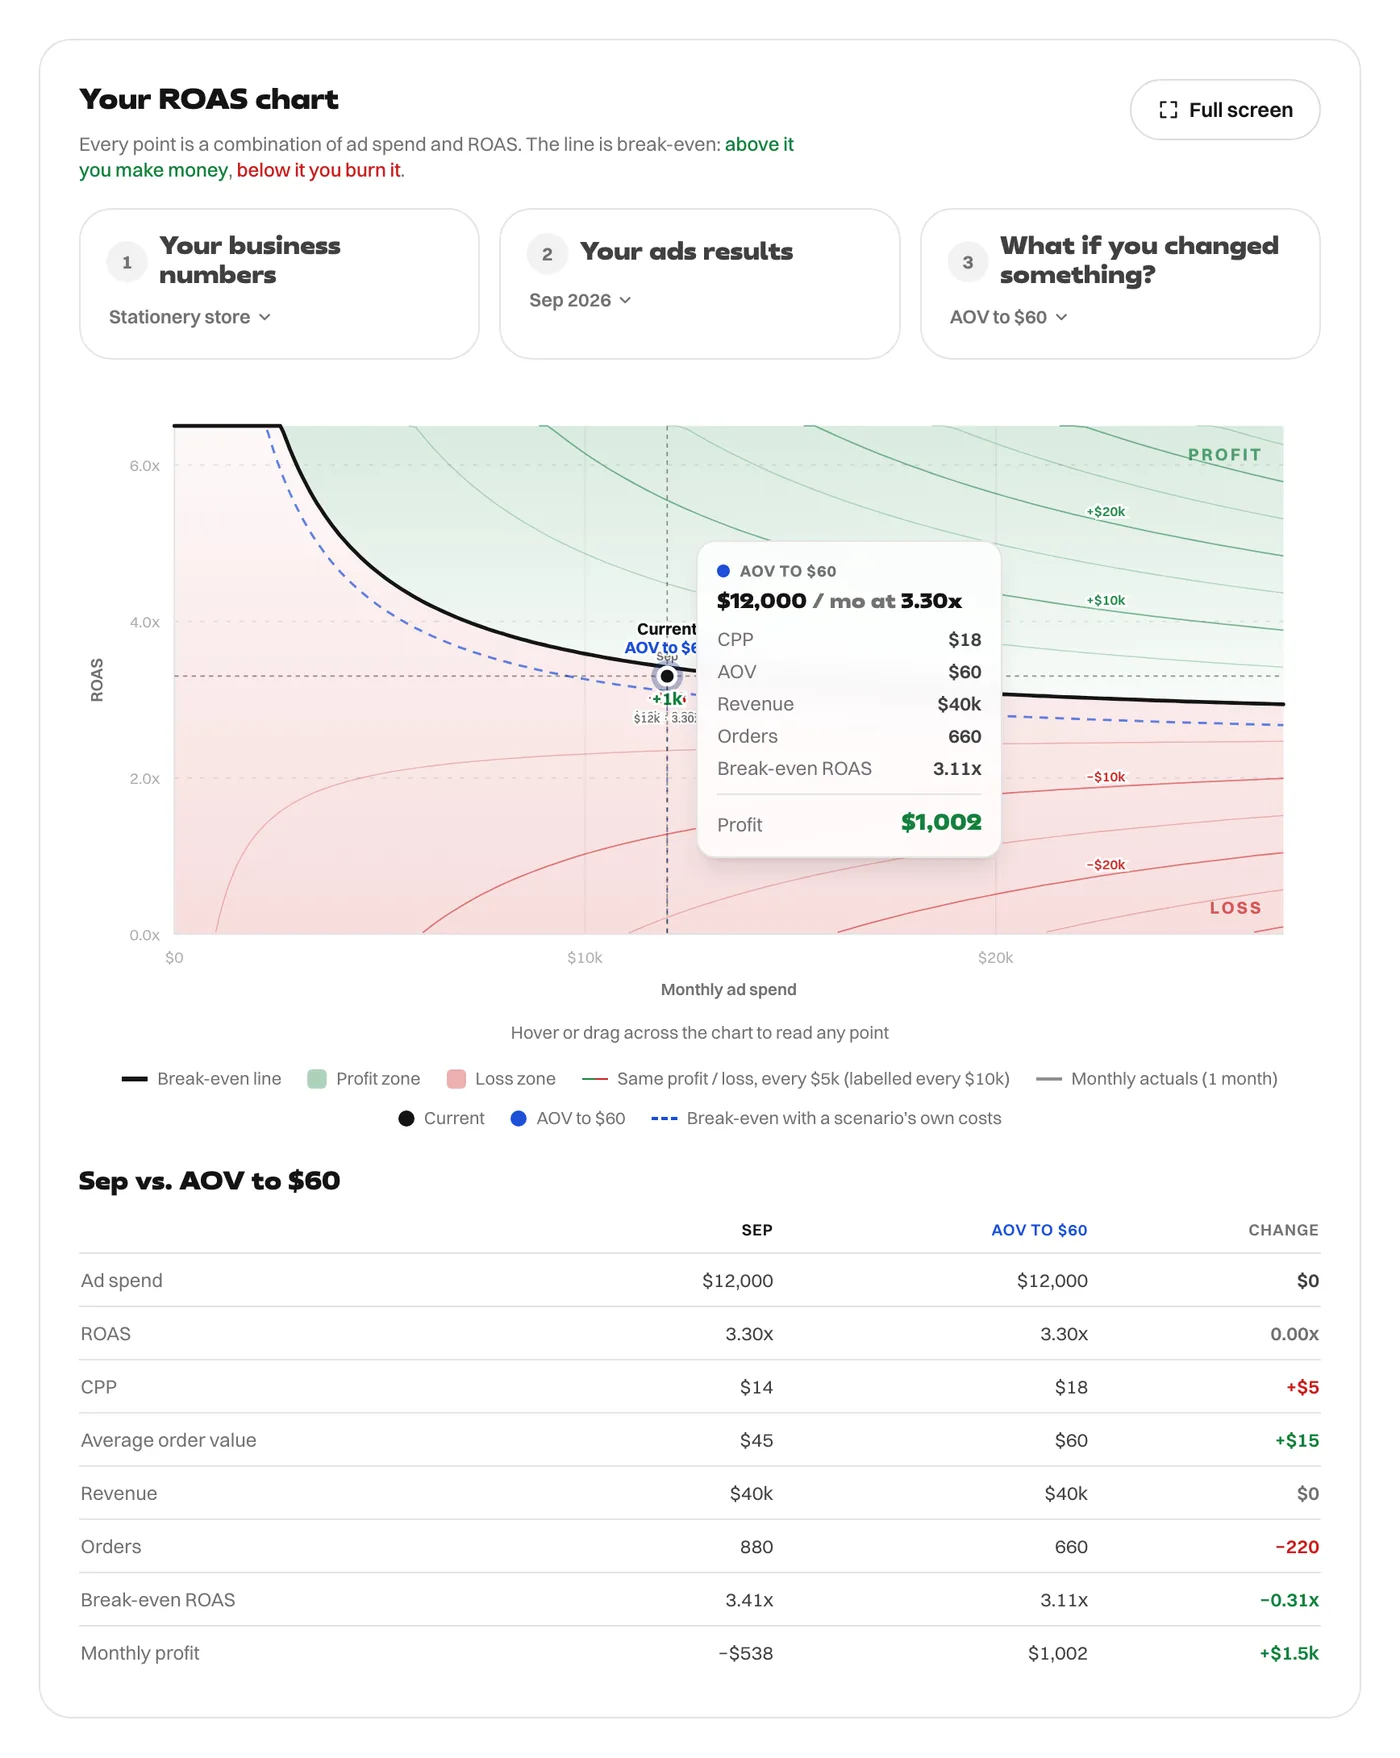
Each order now leaves $25.76, a contribution margin of 42.9%. The $7 shipping is now 12% of the order instead of 16%. Break-even falls from 3.41x to 3.11x, and the month turns from a $538 loss into a $1,002 profit.
The example is deliberately cautious
It keeps ROAS at 3.30x. Look at what that implies: the store took the same revenue from fewer orders, 660 instead of 880, so it assumes a quarter fewer people bought. That is a pessimistic view of bundles.
If the higher AOV came with no drop in conversion rate, the same ad spend would bring the same number of orders at a higher value, and ROAS itself would rise. The profit gain would then be much larger. Reality usually lands between the two, which is why you test.
Ways to raise AOV
- Bundles of products people already buy together.
- A free-shipping threshold set a little above your current AOV.
- Volume pricing: buy two, get 10% off.
- Add-ons at checkout that cost you little to fulfil.
- A higher-priced version of your best-seller.
Each of these costs you something, a discount, a free delivery, so put the new costs into your numbers too. A threshold that raises AOV by $15 but makes you pay shipping on every order may not help.
Where AOV helps most
AOV matters most where per-order costs are large relative to the price: low-price products, heavy or bulky items, and stores that pay for their customers' shipping. For the extreme case, see is a 4x ROAS good, where shipping on a small order makes even 4x a loss. For AOV alongside the other levers, see how to make your ROAS profitable without touching the ads.
Every figure in this article comes from the ROAS Chart calculator, and the screenshots show it with the same numbers. The formulas are written out on the math behind it.