· Updated · 4 min read · ROAS Chart
LTV:CAC for ecommerce: when losing money on the first order is fine
Break-even ROAS assumes a customer has to pay for their ad on the first order. For stores whose customers come back, that is too strict. Here is how to decide how much first-order loss you can afford.
First-order profitability
Every calculation of break-even ROAS on this site asks one question: does the first order pay for the ad that won it? For many stores that is the right question. A customer who never comes back has to be profitable on day one.
But if your customers reorder, a customer is worth more than their first order. Losing money on the first order can then be a deliberate investment, as long as you know exactly how much you are investing and how fast you get it back.
A worked example
A protein snacks store sells at an average of $60 with a 70% gross margin. After $6 shipping, 3% payment fees and 3% refunds, each order leaves $32.94. Fixed costs are $8,000 a month.
It targets new customers only and spends $15,000 a month at 1.60x. Each new customer costs $37.50 to acquire.
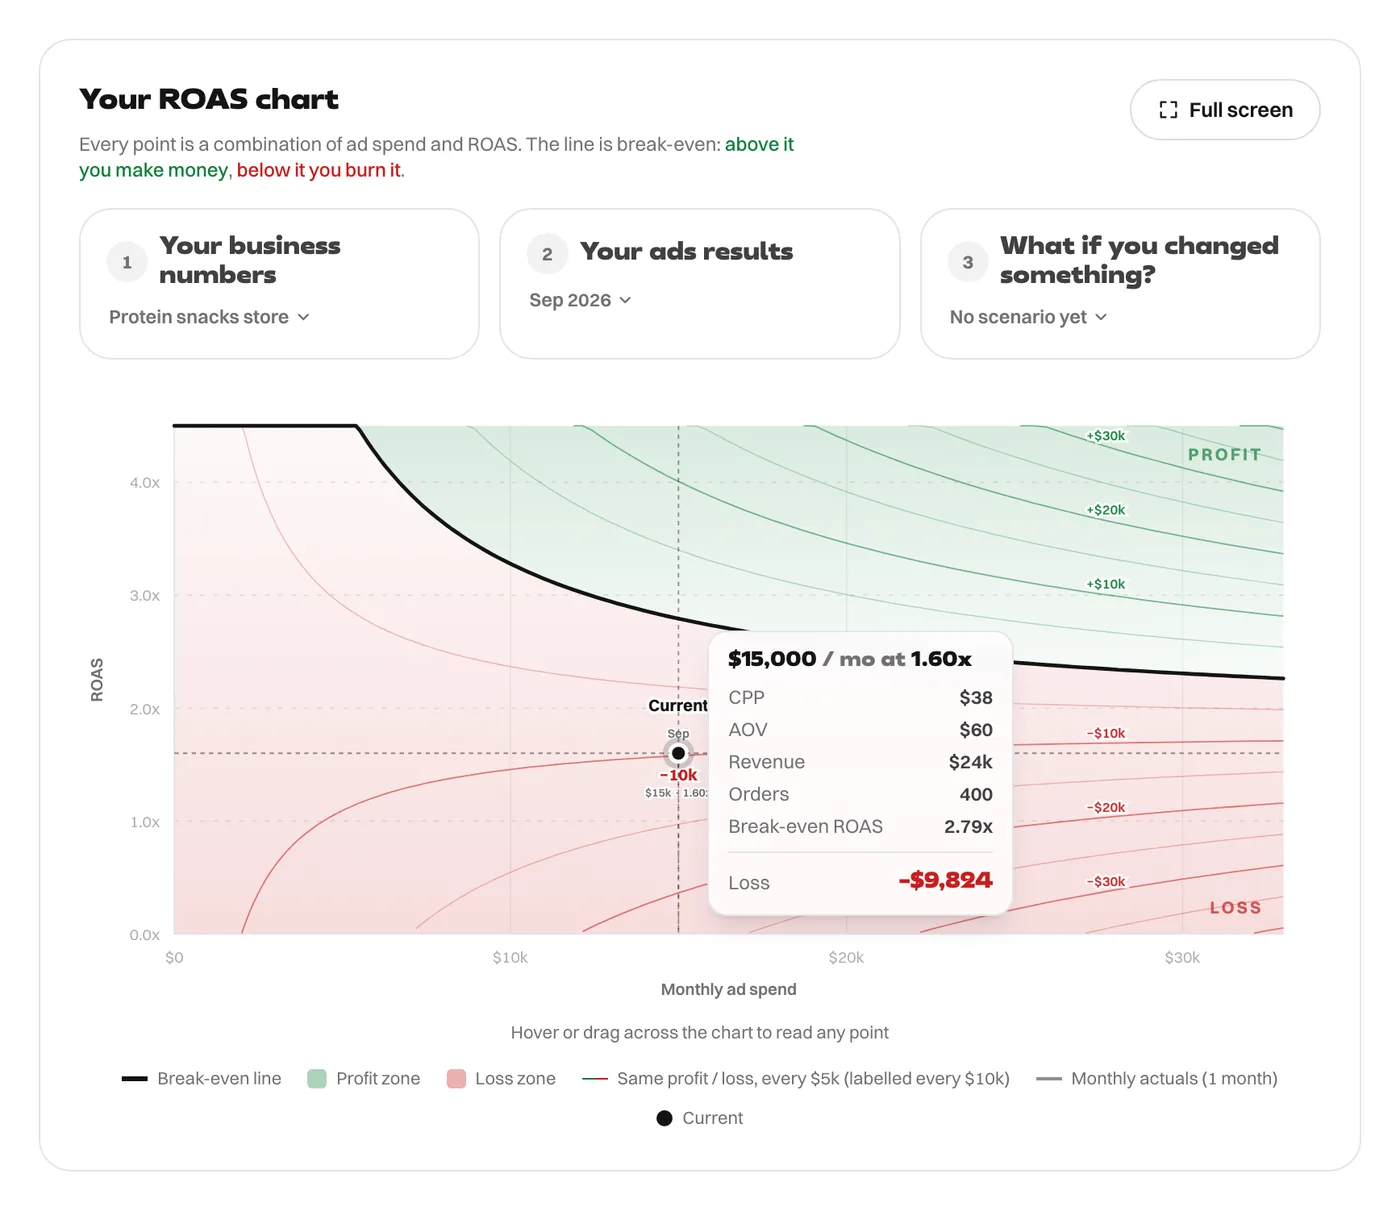
On first orders, this is a bad month: break-even is 2.79x and the month loses $9,824. Each new customer's first order leaves $32.94 but cost $37.50, a loss of $4.56 per customer before fixed costs.
Now add repeat orders
Suppose the store's own data shows that an average new customer places 2.2 orders in their first year, and that repeat orders come mostly through email with little extra marketing cost. Then, per customer:
| Per new customer | Amount |
|---|---|
| Acquisition cost (CAC) | $37.50 |
| Contribution, first order | $32.94 |
| Contribution, 12 months (2.2 orders) | $72.47 |
| LTV : CAC | 1.93 : 1 |
Over a year, each customer contributes $72.47 against a cost of $37.50. The acquisition pays back on the second order, since two orders leave $65.88.
LTV-adjusted ROAS
The same idea applied to ROAS is LTV-adjusted ROAS. Instead of dividing first-order revenue by ad spend, divide all the revenue those customers bring in over a set period, usually 6 or 12 months.
LTV-adjusted ROAS = revenue from the customers you acquired, over N months ÷ the ad spend that acquired them
For this store, $15,000 bought 400 first orders and $24,000 of revenue: the 1.60x the ad platform reports. At 2.2 orders each over twelve months, the same 400 customers bring in $52,800. LTV-adjusted ROAS is 52,800 ÷ 15,000 = 3.52x.
Compare it with the right line. Fixed costs belong to a month, not to a group of customers, so measure LTV-adjusted ROAS against your floor, 1.82x here, which is the ROAS at which each order covers its own costs and its ad. Not against the monthly break-even of 2.79x. At 3.52x, those customers' 880 orders leave $28,987 after their own costs, against $15,000 of ads: $13,987 towards the fixed costs of the months they arrive in.
It reads well, and that is the risk. The 2.2 is an average from past customers, the revenue arrives over a year, and the ad spend left your account this month. Use LTV-adjusted ROAS to decide how much first-order loss is worth funding, and keep plotting first-order ROAS so you can see the size of the bet.
Is that good enough?
An LTV to CAC ratio of about 3 to 1 is often quoted as healthy. This store is at 1.9 to 1. That may be enough for a business with low fixed costs and plenty of cash. But three things still have to be paid for:
- Fixed costs arrive monthly. Repeat orders arrive over the year. The store still has to fund this month's $8,000 of overheads and its $9,824 first-month loss in cash, today.
- Repeat rates are an average. Newer cohorts can behave worse than older ones, especially as you scale into colder audiences.
- Contribution over time is not certain. Discounts to win repeat orders, rising product costs and returns all eat into it.
How to use this
- Measure your real repeat rate from your store data: orders per customer within 3, 6 and 12 months of their first purchase.
- Calculate contribution per customer over the period you are willing to wait for, not revenue.
- Decide the payback period your cash can support. That sets the first-order loss you can afford.
- Set your first-order target from that, and keep plotting first-order ROAS against break-even so you always know the size of the investment. See ROAS vs CPA vs CAC for the difference between the measures.
If your customers rarely reorder, stick with first-order break-even. See the break-even ROAS formula.
Every figure in this article comes from the ROAS Chart calculator, and the screenshots show it with the same numbers. The formulas are written out on the math behind it.