· 3 min read · ROAS Chart
POAS vs ROAS: profit on ad spend, and the trap in it
POAS, profit on ad spend, is ROAS with the revenue swapped for profit. It sounds like the fix for everything wrong with ROAS. It is, if you define profit correctly. Most tools don't.
What POAS is
POAS, profit on ad spend, replaces revenue in the ROAS formula with profit:
POAS = profit from ad-driven sales ÷ ad spend
Its appeal is obvious. A POAS of 1 means the ads paid for themselves out of profit. Above 1 they made money, below 1 they lost it. No need to know your margin to read it.
The catch is in the word "profit". People use it for two different things, and the difference decides whether POAS helps you or misleads you.
Gross profit or contribution?
Many tools calculate POAS from gross profit: revenue minus the cost of the goods. That leaves out shipping, payment fees and refunds, which come with every order.
Calculated from contribution, what an order leaves after all of those, POAS tells you whether the ads truly paid for themselves. From gross profit, it can call a losing campaign a winner.
A worked example
A sneaker store sells at an average of $100 with a 40% gross margin. Shipping costs $9, payments 3%, and 5% of orders are refunded. One order leaves $26.00, a contribution margin of 26.0%. Fixed costs are $10,000 a month.
It spent $20,000 and got a 3.50x ROAS, $70,000 of revenue.
| Measure | Value | Reads as |
|---|---|---|
| ROAS | 3.50x | healthy |
| POAS on gross profit (40%) | 1.40 | profitable |
| POAS on contribution (26%) | 0.91 | losing money |
On gross profit, POAS is 1.40: the ads look like they returned a 40% profit. On contribution it is 0.91: every dollar of ads returned 91 cents after the costs that come with each order. The ads lost money, before fixed costs.
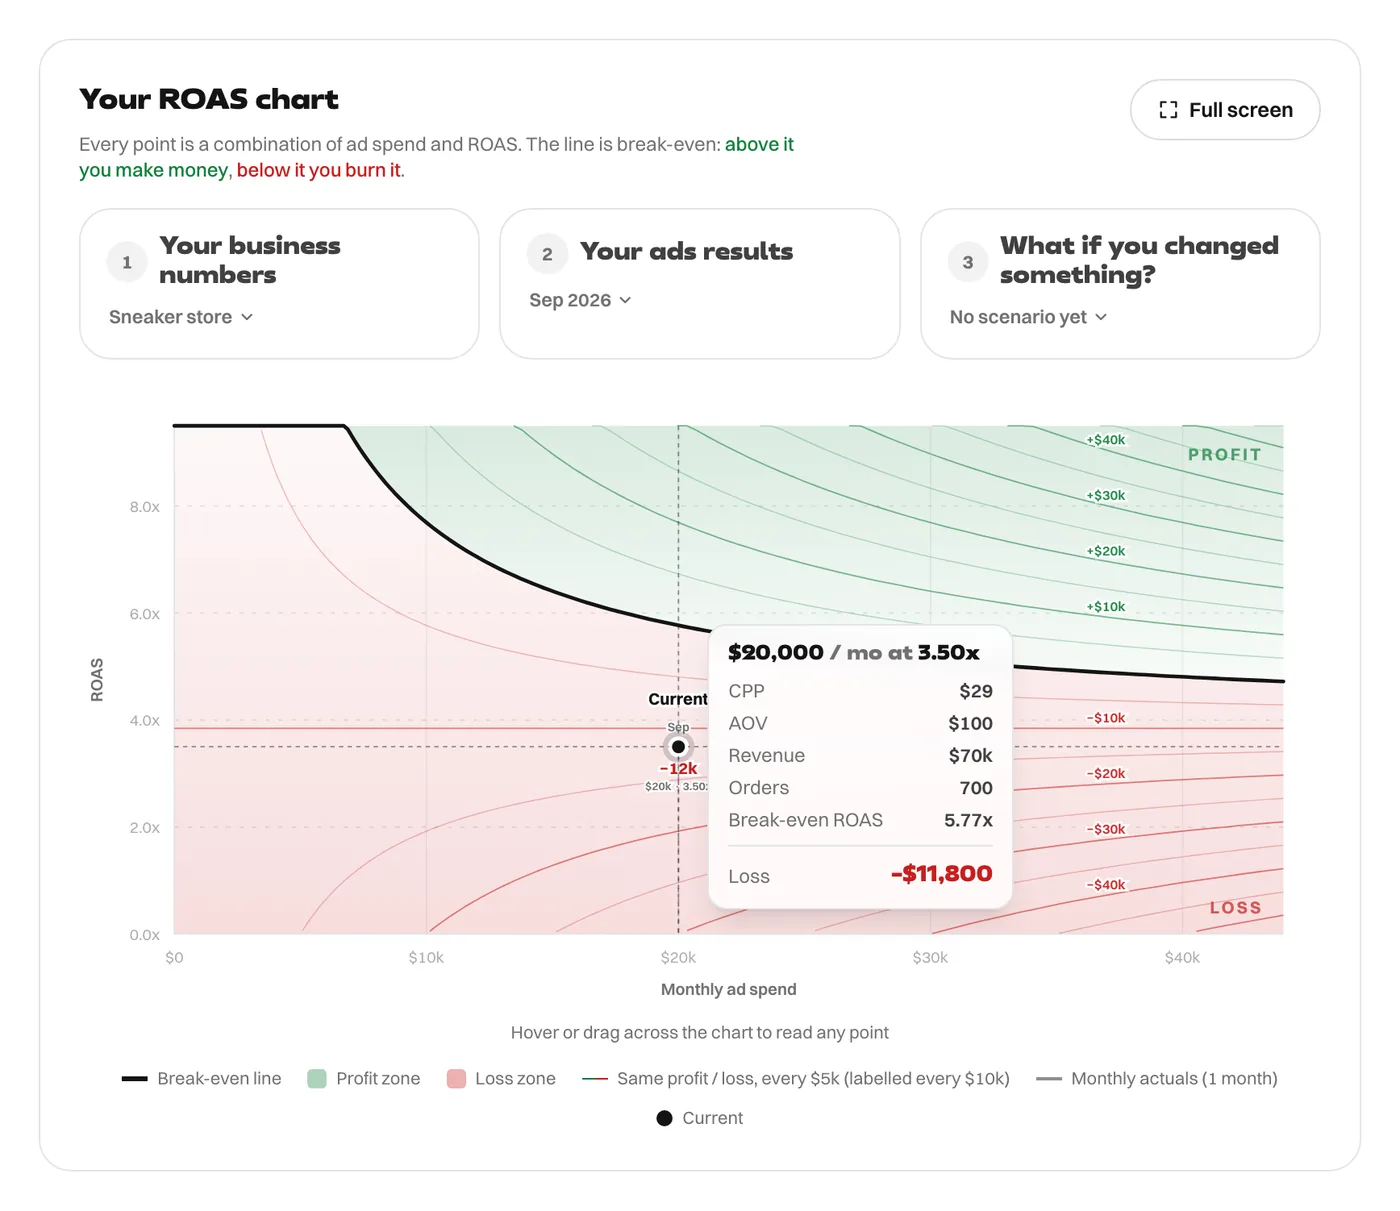
The chart agrees with the contribution version. The store's floor is 3.85x. At 3.50x, it loses money on every order, and the month loses $11,800 once fixed costs are included.
Break-even POAS is not 1
Even calculated properly, "POAS above 1 means profit" is only true before fixed costs. To cover them, POAS has to be higher:
Break-even POAS = 1 + fees on spend + fixed costs ÷ ad spend
For this store at $20,000 a month, that is 1 + $10,000 ÷ $20,000 = 1.50. It is the same line as the break-even ROAS on the chart, expressed in profit instead of revenue: 5.77x × 0.26 = 1.50.
ROAS or POAS?
They are two views of the same thing, and either works if you use it properly:
- If you use ROAS, compare it with your break-even ROAS at your current spend.
- If you use POAS, calculate it from contribution, not gross profit, and compare it with 1 plus your fixed costs over your spend.
- Either way, the platforms only know the revenue you send them. Feeding them profit instead, where they allow it, is how POAS-based bidding works, and it only helps if the profit figure is right.
For why the margin matters so much, see contribution margin vs gross margin. For the floor, see minimum ROAS.
Every figure in this article comes from the ROAS Chart calculator, and the screenshots show it with the same numbers. The formulas are written out on the math behind it.