· 4 min read · Amir Emad
ROAS benchmarks, and why the average is not a target
Every few weeks someone posts their ROAS and asks whether it is normal. The replies arrive fast, and they are all numbers: three, four, two and a half. None of them can answer the question, and the reason is arithmetic rather than opinion.
The short answer
Published averages for ecommerce land somewhere near 2.9x. That figure is real, and it is still useless as a target, because the spread between two ordinary stores is wider than the gap between any two benchmarks you will find.
ROAS measures revenue. What decides whether a month made money is how much of that revenue you keep, and what your business costs to run while you keep it. Neither of those is in the benchmark.
Why a shared number cannot work
Take two stores that both report 3.0x this month. The first keeps 31% of every sale after product, shipping, fees and returns. The second keeps 60%. At 3x, the first store turns every $1 of ads into about 93 cents of contribution, less than the dollar it spent. The second turns the same $1 into $1.79.
Same reported number, opposite businesses. This is worked through with both sets of figures in what is a good ROAS.
A worked example: online grocery
Grocery is the clearest case, because the margins are thin and the benchmark is furthest from the truth.
Say an average order of $120 at a 30% gross margin, $8 to pick and ship it, payment fees of 2.9%, and 1% of orders refunded. That leaves $24.16 of every order, which is 20.1% of the sale. Divide 1 by that and the floor, the lowest ROAS that could ever break even, is 4.97x. Add $15,000 a month of salaries and overheads and the real break-even is higher still: 7.45x at $30,000 of monthly spend, 6.21x at $60,000.
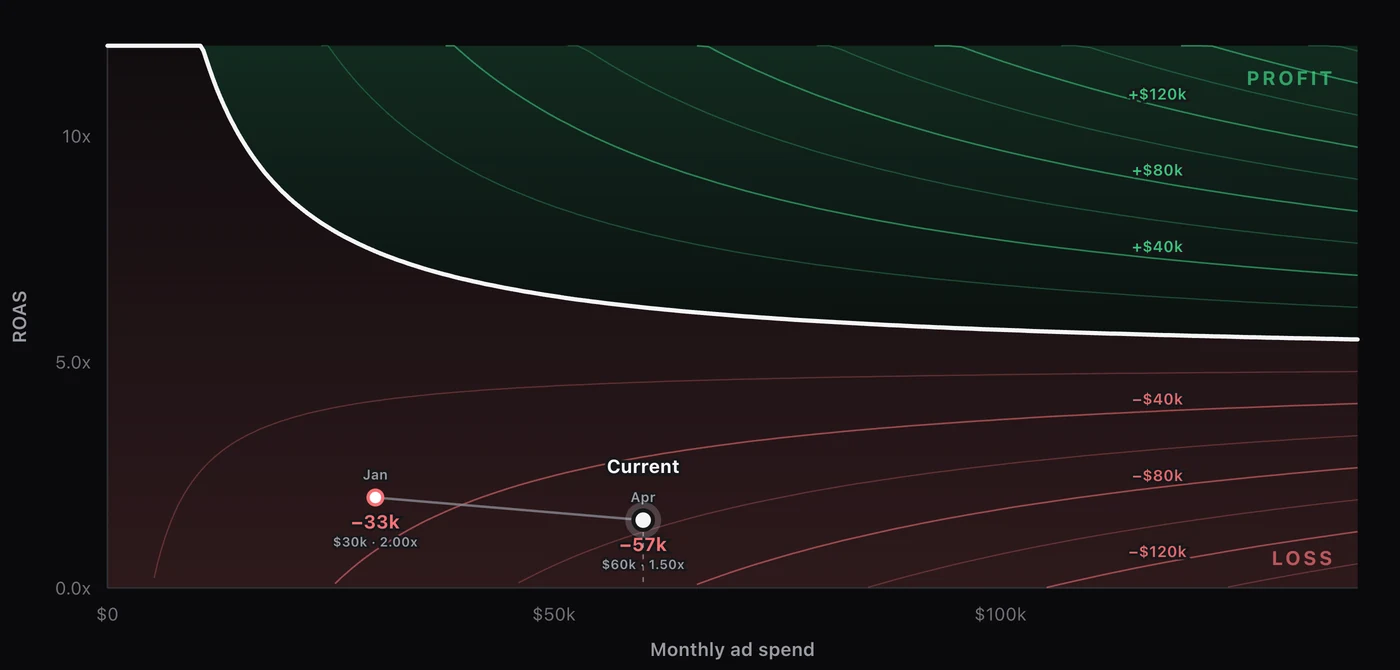
A grocery store hitting the 2.9x average would be losing money on a scale that no amount of creative testing fixes. Against the published benchmark it looks slightly below par. Against its own line it is not in the same postcode.
What to use instead
Three numbers replace the benchmark, and all three are yours:
- Contribution margin. One average order, minus product cost, shipping, payment fees and the margin lost to refunds, divided by the order value.
- Your floor. 1 divided by that margin. No budget can take you below it, so if the ROAS you actually get is under the floor, the problem is the product or the price, not the media buying.
- Your break-even at the spend you actually run. The floor plus your fixed costs spread across the month. This is the number a campaign has to clear, and it falls as you spend more.
The formula for the third one, including the fixed costs almost every calculator leaves out, is in the break-even ROAS formula. If you advertise from the UAE, remember the 5% VAT on ad spend rides on top of it, which moves the line more than people expect.
If you still want a benchmark
There is one comparison worth making, and it is not against other stores. Multiply your ROAS by your contribution margin. Below 1 and you are losing money on every order, whatever the industry average says. Above 1, the surplus is what pays your fixed costs, and whether it covers them depends on how much you spent.
That test takes ten seconds and tells you more than any table of averages by category.
Every figure in this article comes from the ROAS Chart calculator, and the screenshots show it with the same numbers. The formulas are written out on the math behind it.