· 3 min read · ROAS Chart
Unit economics: one order, from price to profit
Unit economics sounds like something for investor decks. For a store that advertises, it is the most useful hour of analysis you can do: one order, followed from price to profit, shows you exactly where the money goes.
What unit economics means for an online store
Unit economics is the profit or loss on one unit of your business. For an ecommerce store, the natural unit is one order. Follow a single average order from the price the customer pays to what is left at the end, and you see the whole business in one column of numbers.
There are four numbers to know:
- Average order value: what a typical order brings in.
- Contribution per order: what is left after the costs that come with each order.
- Cost per purchase: what you pay in ads to win the order.
- Fixed cost per order: your monthly fixed costs divided by the orders you ship.
A worked example
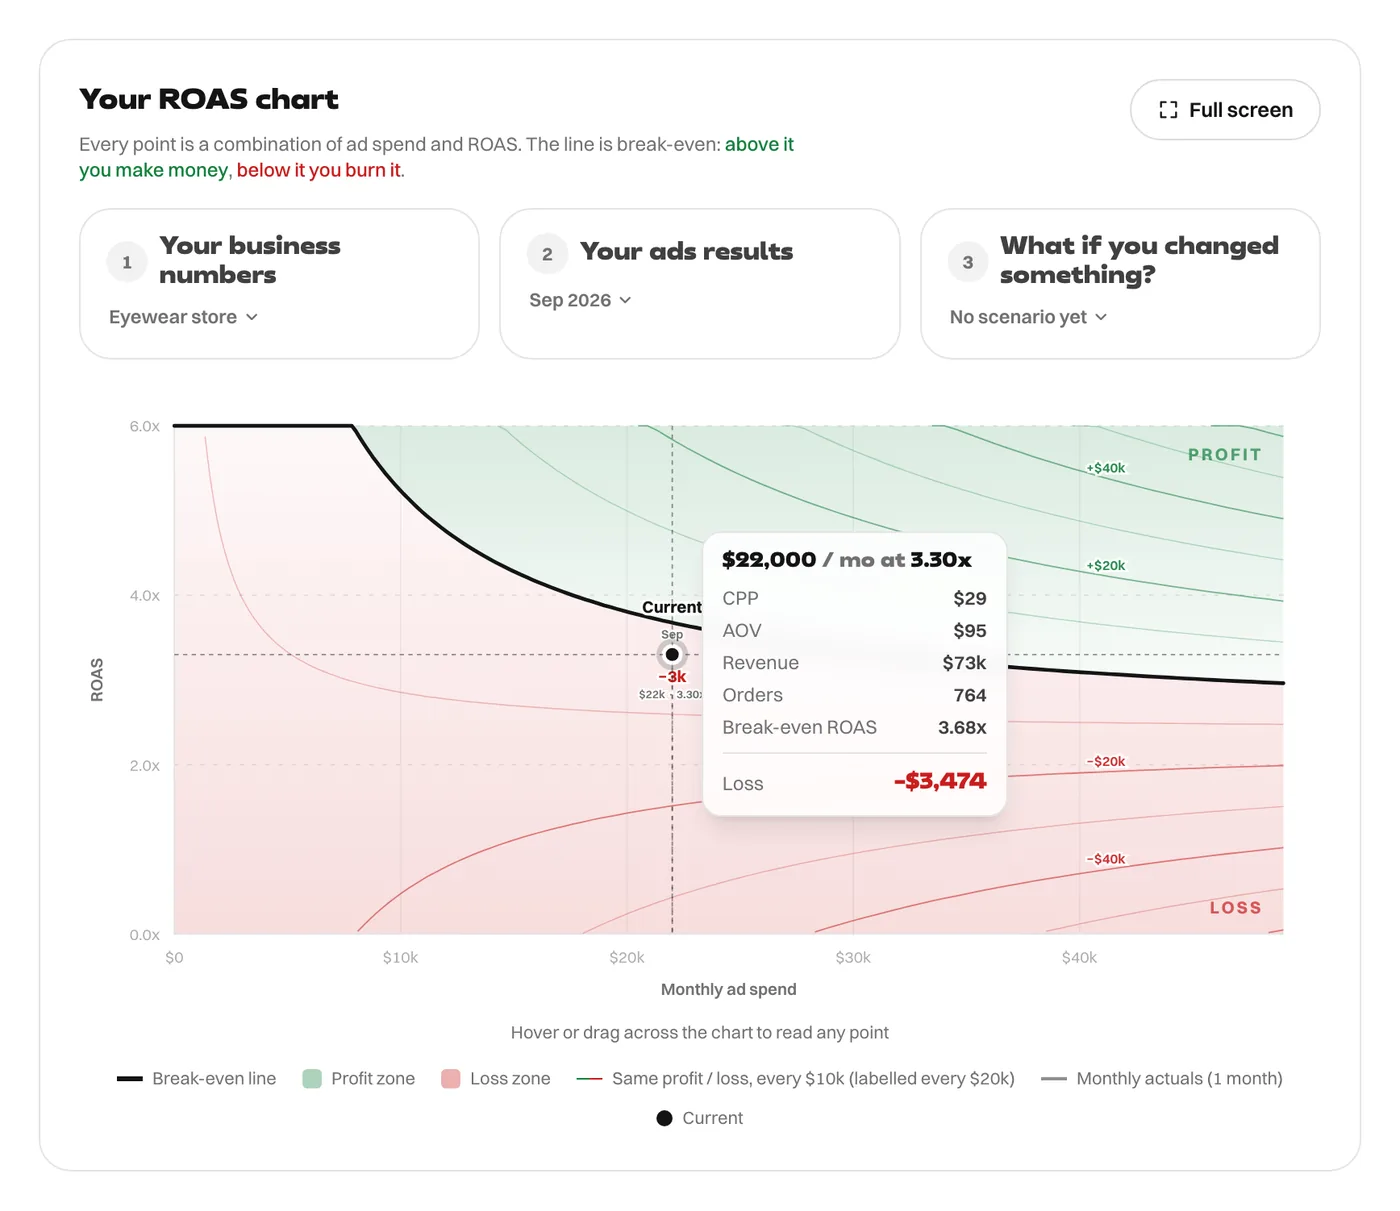
An eyewear store spends $22,000 a month on ads at 3.30x, which brought in 764 orders at an average of $95. Its fixed costs are $12,000 a month. Here is one average order:
| Per order | Amount |
|---|---|
| Order value | $95.00 |
| Product cost (58% gross margin) | −$39.90 |
| Shipping | −$9.00 |
| Payment fee (3%) | −$2.85 |
| Refunds (6% of orders) | −$3.31 |
| Contribution | $39.94 |
| Ad cost per purchase | −$28.79 |
| Profit before fixed costs | $11.16 |
| Share of fixed costs | −$15.70 |
| Net per order | −$4.55 |
Each order makes $11.16 after its own costs and its ad. That is not enough to carry its $15.70 share of the fixed costs, so each order loses $4.55. Across 764 orders, the month loses $3,474.
What the column tells you
Every line in that table is a lever, and the table shows how much each one is worth:
- Cost per purchase is the biggest single cost after the product. Cutting it by $5 would make each order roughly $0.45.
- The share of fixed costs falls as you ship more orders. At twice the volume it would be $7.85, if the cost per purchase held, which it usually doesn't when you scale.
- Contribution is set by price, product cost, shipping and refunds. A $5 improvement there is worth exactly as much as a $5 cheaper purchase.
So what is the most this store can pay per purchase? At $22,000 a month, it is the order value divided by the break-even ROAS: $95 ÷ 3.68x = $25.85. It is not simply the contribution minus today's fixed-cost share, because a cheaper purchase also brings more orders to share the fixed costs. See break-even cost per purchase for the detail.
Do this for your store
Build the column from last month's real numbers: your average order, your product cost, your actual shipping bill divided by orders, your payment fees, your refunds, your ad spend divided by purchases, your fixed costs divided by orders. It takes an hour, and it tells you more about your business than any dashboard. For the difference between the margins in the column, see contribution margin vs gross margin.
Every figure in this article comes from the ROAS Chart calculator, and the screenshots show it with the same numbers. The formulas are written out on the math behind it.