· 3 min read · ROAS Chart
What is a good profit margin for an ecommerce store?
Ask what a good profit margin is and you will get numbers anywhere from 10% to 70%. They are all answers to different questions. Here are the four margins that matter for a store that advertises, and how one turns into the next.
Four margins, not one
"Profit margin" can mean at least four different things, and each answers a different question:
- Gross margin: revenue minus product cost. Is the product priced well?
- Contribution margin: after shipping, payment fees and refunds too. Does each order make money on its own?
- Contribution after ads: after the ad spend that won the orders. Does advertising pay?
- Net margin: after fixed costs as well. Does the business make money?
For a store that advertises, the gap between the first and the last is often enormous. That is why "a 60% margin" can sit alongside a business that barely breaks even.
A worked example
A homewares store sells at an average of $110 with a 62% gross margin. It spends $40,000 a month on ads at 3.80x, which brought in $152,000 of revenue. Fixed costs are $25,000 a month.
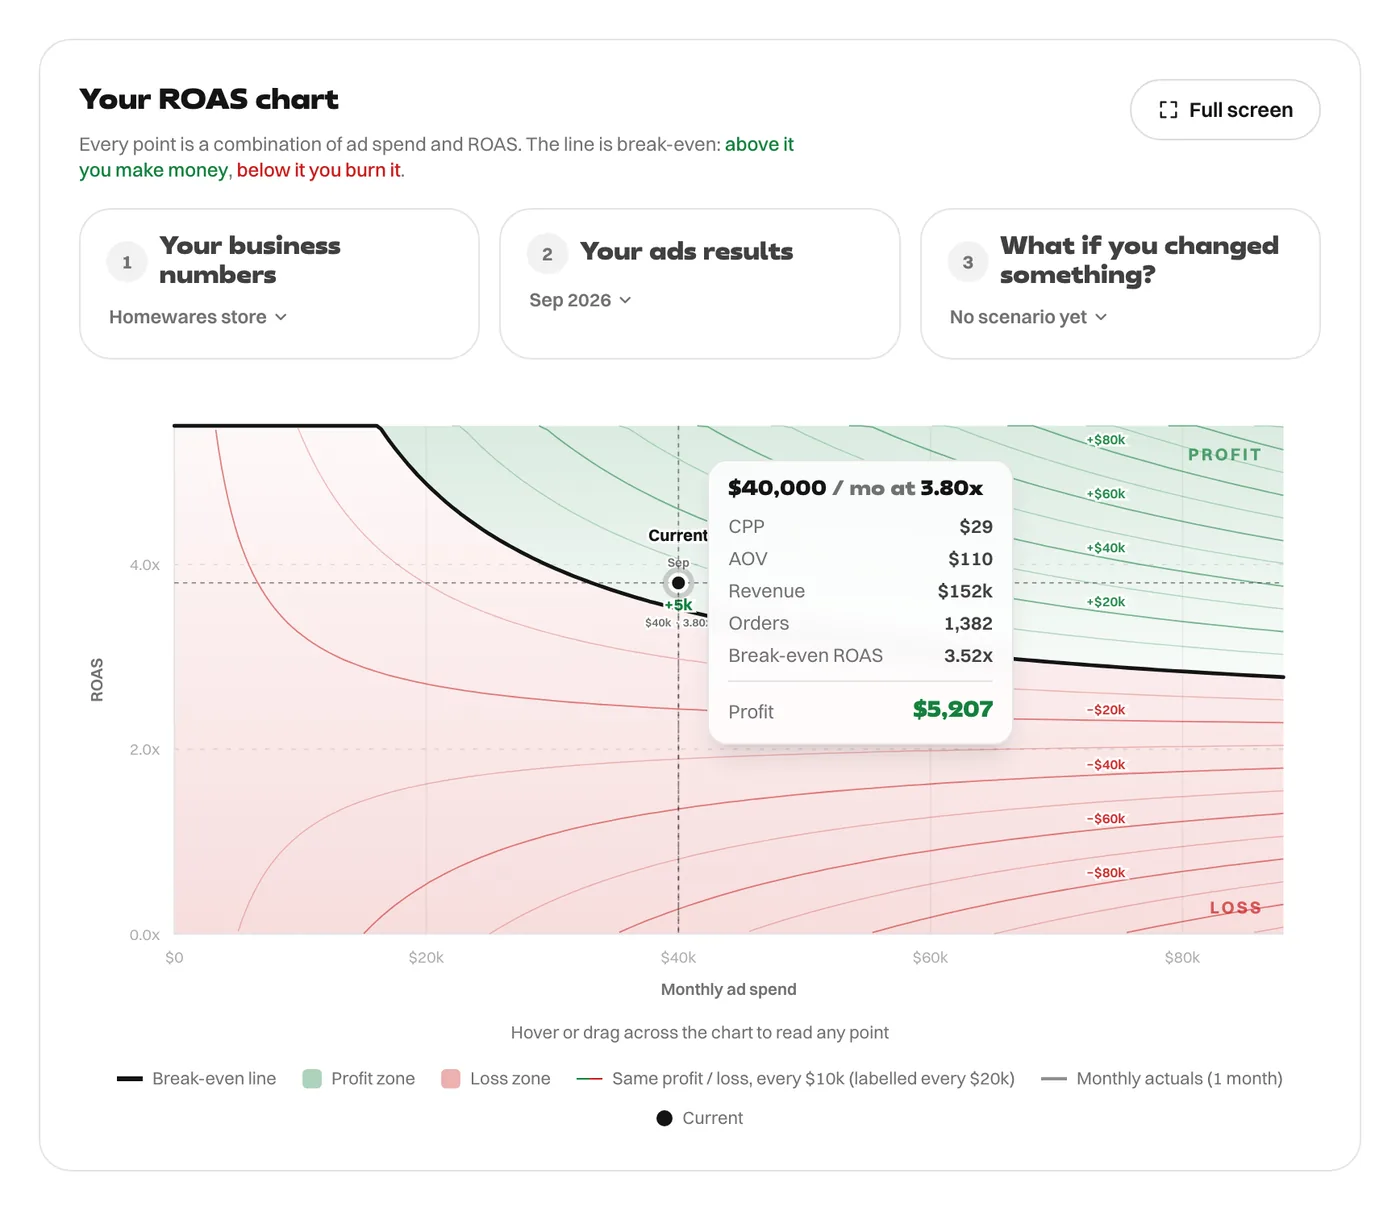
The month is profitable, by $5,207. Here is how the margin falls away on the way there:
| Margin | Share of revenue |
|---|---|
| Gross margin | 62.0% |
| Contribution margin | 46.2% |
| Contribution after ad spend | 19.9% |
| Net margin, after fixed costs | 3.4% |
A 62% gross margin ends up as a 3.4% net margin. Shipping, payment fees and refunds take 15.8% of revenue. The ads take 26.3% (at 3.80x, ad spend is 1 ÷ 3.8 of revenue). Fixed costs take 16.4%.
So what is a good profit margin?
There is no single right answer, and benchmarks vary a lot by category, but a few principles hold for every store:
- Net margin has to be positive at your current spend. This store's is, just.
- Net margin is very sensitive to ROAS. The ads take 1 ÷ ROAS of revenue, so small changes in ROAS move net margin a lot. At 3.5x instead of 3.80x, the ads would take 28.6% of revenue instead of 26.3%, and most of this store's net margin would be gone.
- Contribution margin sets your ceiling. Net margin can never be higher than contribution margin minus your ad spend share. Improving it lifts everything below it.
- Fixed costs shrink as a share with scale. The same $25,000 would be half the share of revenue at twice the sales.
A useful way to write the whole thing in one line:
Net margin = contribution margin − 1 ÷ ROAS − fixed costs ÷ revenue
(add any VAT or agency fee to the ad term). It shows directly how each of your levers moves the bottom line.
For the first two margins in detail, see contribution margin vs gross margin. For all of them on a single order, see unit economics for ecommerce.
Every figure in this article comes from the ROAS Chart calculator, and the screenshots show it with the same numbers. The formulas are written out on the math behind it.