· 3 min read · ROAS Chart
The break-even point for a store that advertises
Every business has a break-even point: the sales that cover the fixed costs. For a store that buys its sales with ads, the textbook formula leaves out the biggest cost. Here is the version that doesn't.
Fixed costs and variable costs
Break-even rests on splitting your costs in two, and the split is about behaviour rather than size.
Variable costs arrive with the order. The product itself, the packaging, the shipping, the payment processor's cut, the share of orders that come back. Sell nothing and you pay none of them.
Fixed costs arrive anyway. Rent, salaries, software, the accountant. Sell nothing in March and they still land in March.
What one order leaves behind after its own variable costs is the contribution margin, and it is the only money there is for covering the fixed costs. Break-even is the point where it finally does.
Advertising is the awkward one. It behaves like a variable cost, because you turn it up and down and it buys orders, but you commit to it before any order exists. That is why it sits outside the textbook formula and why the textbook formula misleads a store that advertises.
The classic break-even point
The textbook break-even point is the sales volume at which your contribution covers your fixed costs:
Break-even revenue = fixed costs ÷ contribution margin
Or, if you would rather count orders than money:
Break-even units = fixed costs ÷ contribution per unit
Take the store below: $15,000 of fixed costs a month and $33.50 of contribution on a $75 order. That is 448 orders, about $33,600 of revenue, and most break-even calculators online will stop there.
For a store that does not advertise, that is the whole answer. For a store that buys its sales, it leaves out the biggest cost: the ads. Every dollar of revenue you buy costs you ad spend, so the ROAS you achieve decides how much of each sale is left to pay the fixed costs.
The gap is not small. That same store, buying its orders at a 3.50x ROAS, needs 1,243 orders rather than 448. Nearly three times the volume, from the same fixed costs and the same margin, because the textbook version quietly assumes the orders arrive free.
Break-even point for a store that advertises
At a given ROAS, each dollar of ad spend brings in ROAS dollars of revenue, which leave ROAS × contribution margin, of which one dollar goes to pay for the ad. What remains goes toward fixed costs. So:
Break-even ad spend = fixed costs ÷ (ROAS × contribution margin − 1)
Break-even revenue = break-even ad spend × ROAS
(If you pay VAT or an agency fee on ad spend, replace the 1 with 1 plus that percentage.)
A worked example
A watch store sells at an average of $75 with a 60% gross margin. After $7 shipping, 3% payment fees and 5% refunds, each order leaves $33.50, a contribution margin of 44.7%. Fixed costs are $15,000 a month.
Here is how much it must spend, sell and ship each month to break even, at different ROAS levels:
| At a ROAS of | Ad spend needed | Revenue needed | Orders needed |
|---|---|---|---|
| 2.50x | $128,571 | $321,429 | 4,286 |
| 3.00x | $44,118 | $132,353 | 1,765 |
| 3.50x | $26,627 | $93,195 | 1,243 |
| 4.00x | $19,068 | $76,271 | 1,017 |
| 5.00x | $12,162 | $60,811 | 811 |
The better your ROAS, the less you need to sell. At 5x, about 811 orders a month cover everything. At 2.5x, you need more than 4,286, and a ROAS at or below the floor of 2.24x would need infinite sales.
Where the store is now
This month the store spent $25,000 at 3.50x. The table says that at 3.5x it needs $26,627 of spend to break even, a little more than it ran:
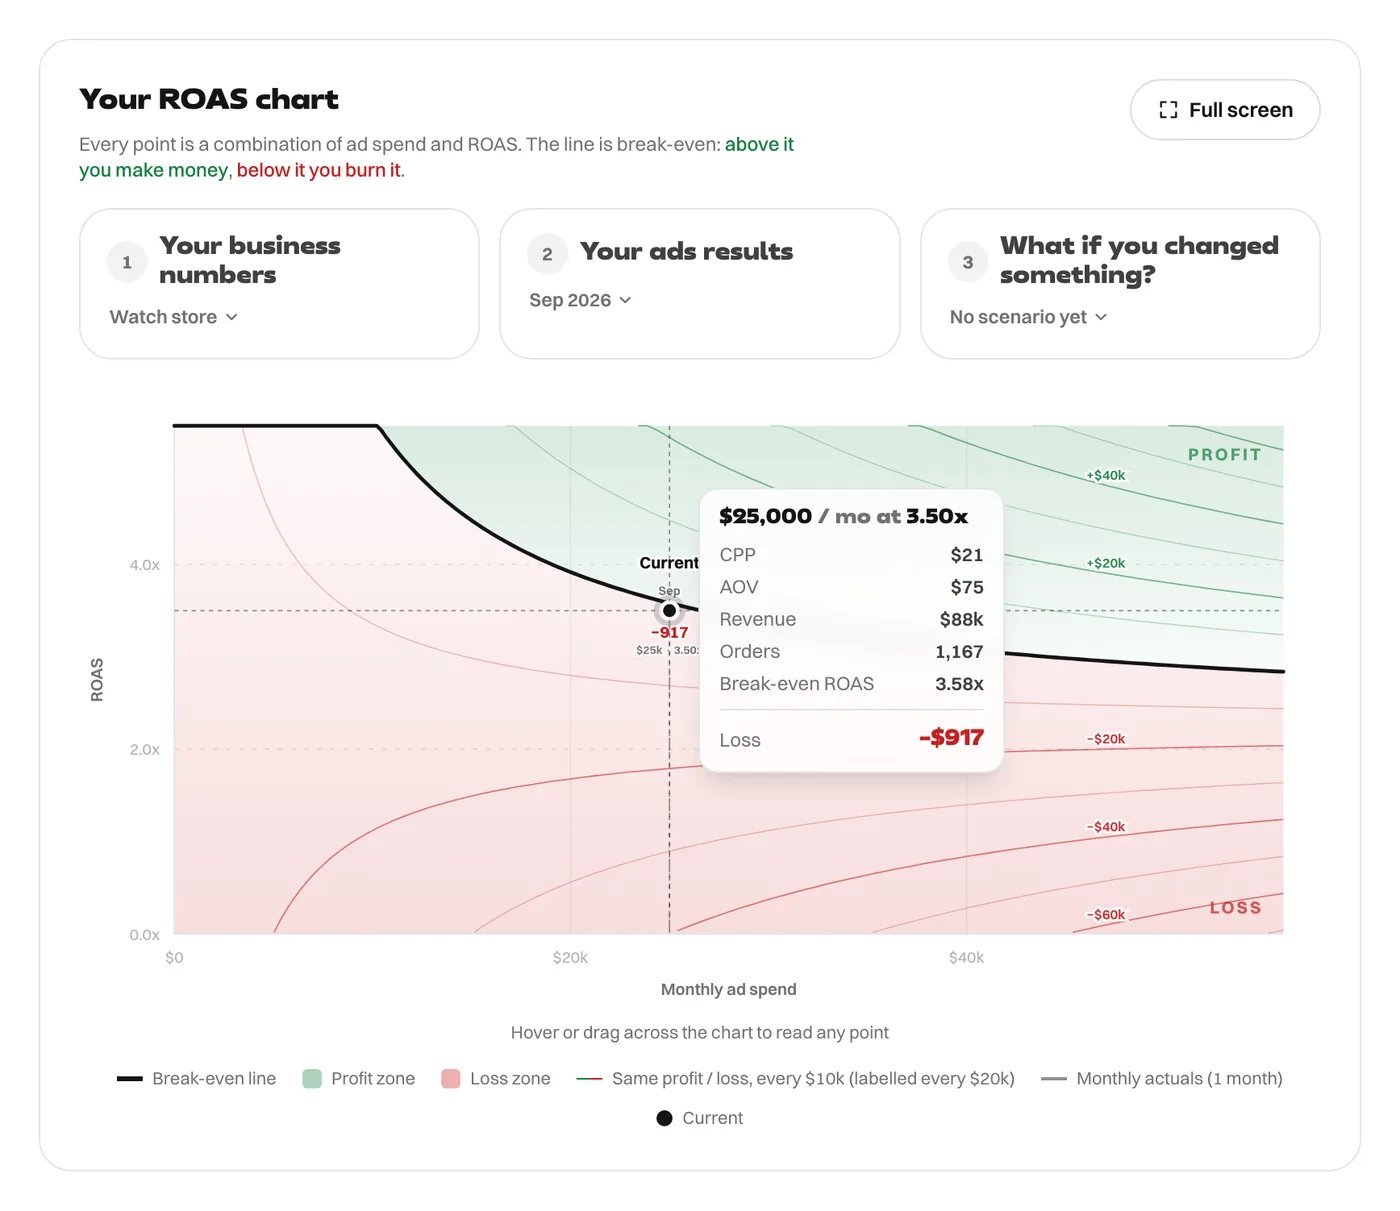
Break-even at $25,000 is 3.58x, and the month loses $917. Holding 3.5x on another $1,627 of spend would get it to break-even.
Margin of safety
Break-even tells you where the floor is. Margin of safety tells you how far above it you are standing:
Margin of safety = (actual revenue − break-even revenue) ÷ actual revenue
The watch store turned over $87,500 against a break-even of $93,195, so its margin of safety is −6.5%. Sales would have to rise by that much just to reach nothing. A healthy store wants this comfortably positive, because it is the room you have before a bad month becomes a loss.
It is worth recalculating whenever the ROAS moves, because the break-even revenue moves with it. Lift the ROAS to 4.00x and break-even falls to $76,271 of revenue, so the same $87,500 of sales sits 12.8% above the line instead of 6.5% below it. Identical sales, same costs, and the difference between a loss and a cushion is which ROAS bought them.
Using your break-even point
- Know your break-even revenue at the ROAS you realistically get. It is your minimum monthly sales target.
- Treat ROAS and volume together. A lower ROAS is fine if you can sell enough more, and a higher ROAS lets you break even on less.
- If the volume needed is unrealistic, the levers are fixed costs and contribution margin, not the ad account. See how to make your ROAS profitable without touching the ads.
For the related question of how big your ad budget should be, see how much to spend on Facebook ads.
What break-even analysis will not tell you
It is a snapshot of one month at one set of numbers, and it is honest about nothing else:
- It assumes your costs hold. Fixed costs step up when you hire or take more warehouse space, and the floor moves with them.
- It assumes ROAS holds as you scale. It usually does not. Spending more generally buys worse traffic, so the ROAS you break even at is not always the ROAS you can hold.
- It ignores timing. Breaking even across a month says nothing about whether the cash was there in week two, which is what actually stops businesses.
- It ignores repeat buyers. If customers come back, losing money on the first order can still be right. Break-even counts the month in front of you, not the year.
None of that makes it useless. It makes it a floor rather than a forecast.
Break-even point questions
Is the break-even point measured in units or in revenue? Either, and they are the same statement. Units suit a single product; revenue suits a store with a mixed basket, where an average order value stands in for the unit.
Should ad spend be a fixed or a variable cost? Neither cleanly, which is the whole difficulty. It scales with what you sell, like a variable cost, but you commit it in advance, like a fixed one. Treating it as a variable cost tied to your ROAS is what the formula above does.
Why is my break-even point different every month? Because it depends on the ROAS you ran and on fixed costs that are only fixed until they are not. A single number pinned to the wall goes stale quickly.
What if the orders needed look impossible? Then the ad account is not the problem. Either the fixed costs are too high for the sales you can realistically make, or the margin on each order is too thin. Both sit outside the ads, which is where people usually look first.
Is there a ROAS below which there is no break-even point at all? Yes. Below your contribution-margin floor, each order loses money before any fixed costs are counted, so no amount of volume gets you there. For this store the floor is 2.24x, and that is why the table stops where it does.
Every figure in this article comes from the ROAS Chart calculator, and the screenshots show it with the same numbers. The formulas are written out on the math behind it.