· 5 min read · ROAS Chart
Why did my ROAS drop? How to tell whether it actually matters
A ROAS that falls from one month to the next feels like an emergency. Sometimes it is. Often it is not, and the expensive mistake is reacting to a drop that never threatened your profit. Here is how to tell the difference, and what usually causes it.
First question: did it cross your break-even line?
ROAS on its own cannot tell you whether a drop matters, because the ROAS you need depends on your margin, your fixed costs and how much you spend. What matters is the gap between the ROAS you got and your break-even ROAS at that budget.
A skincare store: $65 average order, 70% gross margin, $6 shipping, 2.9% payment fees, 4% of orders refunded. Each order leaves $35.80, a 55.1% contribution margin. Salaries and other fixed costs come to $12,000 a month, and it spends $20,000 on ads every month.
In August it got 4.10x. In September, on the same budget, it got 3.40x. A 17% drop, the kind that starts a long meeting.
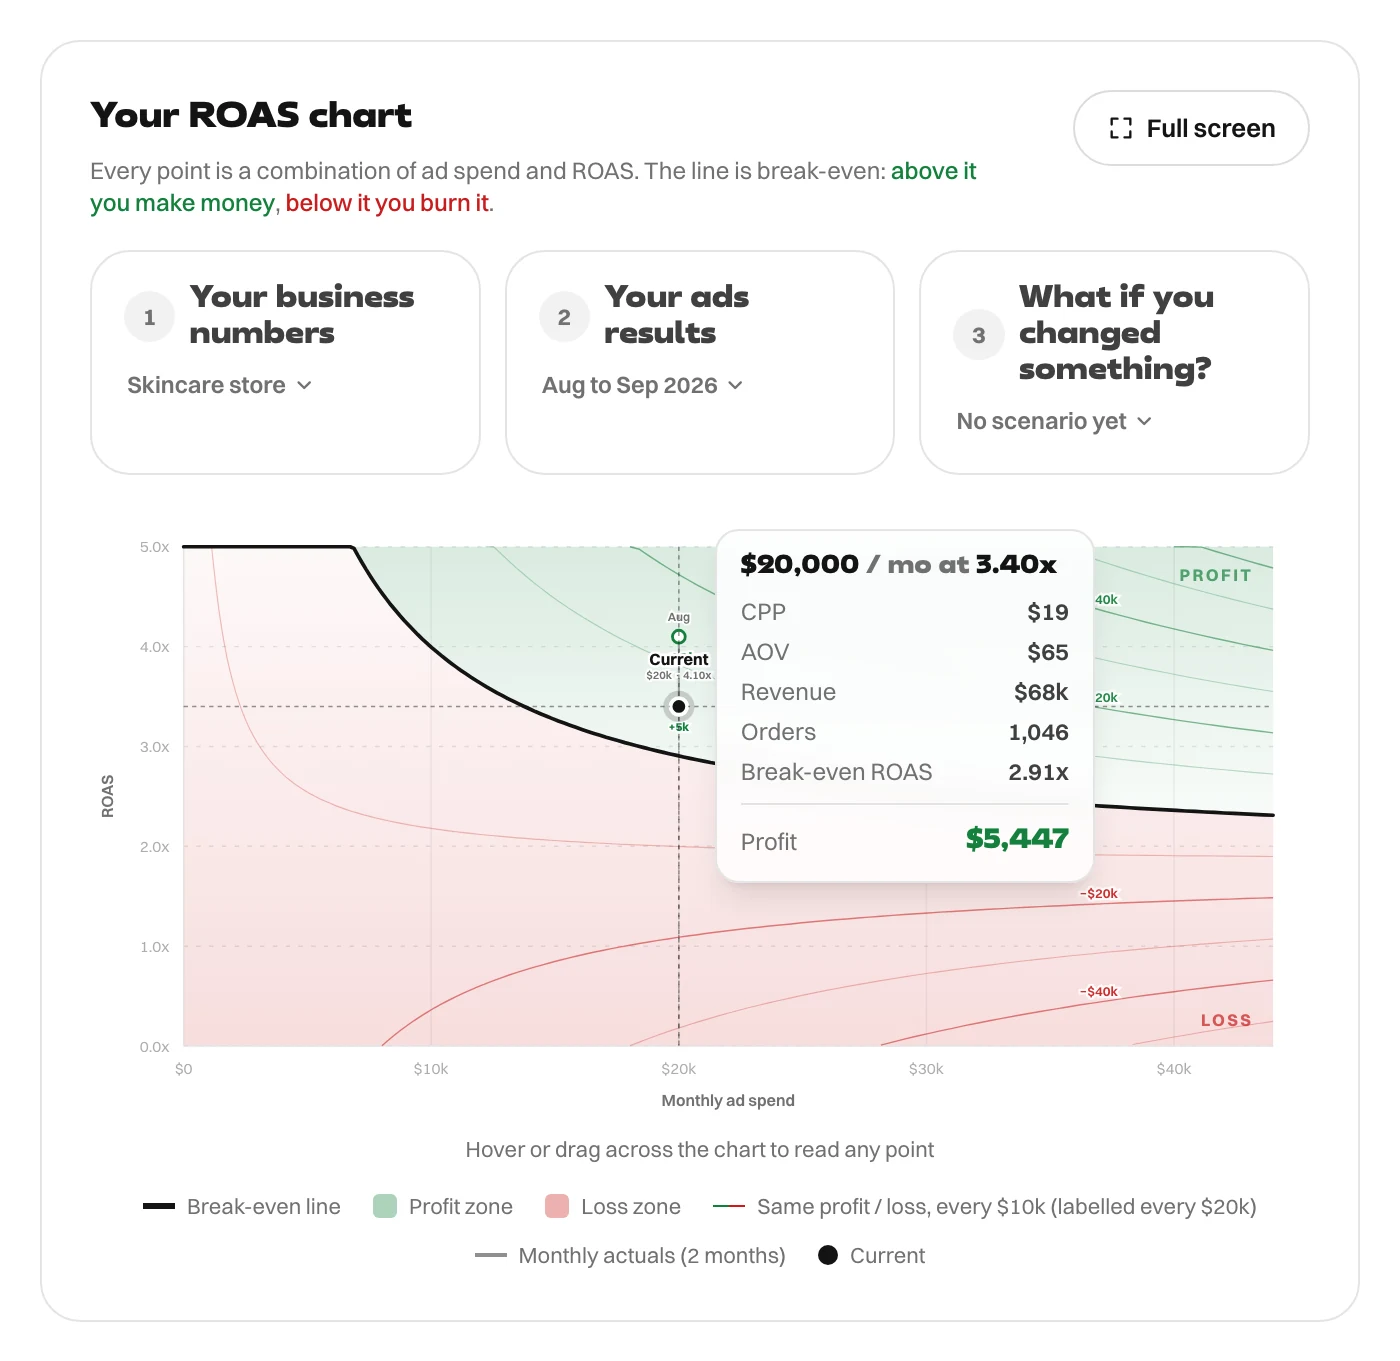
Break-even at $20,000 is 2.91x. August made $13,157. September made $5,447. The drop cost $7,710 of profit, which is real money, but the store is still comfortably above the line. This is something to investigate calmly, not a fire.
A further fall to 2.80x would be different. That is below the 2.91x line, and the month would lose $1,161. Whether a drop matters is decided by where it lands, not by how big it is.
Do not cut the budget first
The usual reaction is to cut spend to "protect ROAS". Look at what that buys here. Break-even rises as spend falls, because the same $12,000 of fixed costs is spread over less revenue: at $14,000 a month the store needs 3.37x.
If the cut does nothing for ROAS and it stays at 3.40x, the month makes $213. If the cut works perfectly and ROAS climbs all the way back to 4.10x, the month makes $5,610, barely more than the $5,447 it was already making at $20,000.
So the best case for cutting only just beats doing nothing, and the likely case is far worse. Find the cause before you touch the budget.
The usual reasons ROAS drops
Once you know whether the drop matters, find out why it happened. Most drops come from one of these.
- You spent more. ROAS almost always falls as the budget rises, because each extra dollar reaches people less likely to buy. That is normal and often profitable: see why ROAS drops when you scale.
- A sale ended. A promotion lifts conversion rate and ROAS while it runs, so the weeks after look weak by comparison. Compare against the weeks before the sale, not the sale itself. A sale also raises your break-even while it runs, because the discount comes out of your margin.
- Seasonality. Most stores sell more in some months than others. If your ROAS is lower than last year, compare the same month a year apart rather than this month with last month.
- Tracking or attribution changed. A new attribution window, a broken pixel or a checkout change can move reported ROAS without changing sales at all. Check your store's own revenue against total ad spend before trusting the platform: MER vs ROAS shows how.
- Creative fatigue. The same ads shown too often to the same people stop working. Rising frequency with falling click-through rate is the usual sign.
- The offer changed. A price rise, your best seller going out of stock, slower delivery or a lower average order value all lower ROAS with identical ads.
When ROAS plateaus instead of dropping
A ROAS that stops improving usually means you have reached the most responsive part of your audience at this budget. Pushing harder on the ads rarely moves it. The productive question is how to move your break-even line instead: average order value, returns, shipping and fixed costs. Lowering the line is often easier than raising ROAS.
A five-minute check
- Put this month's spend and ROAS on your chart next to last month's.
- Read your break-even ROAS at this month's budget. Are you above it or below it?
- If you are above it, note what the drop cost and investigate without changing the budget.
- Compare with the same month last year, and with the weeks before any sale.
- Check your store's own revenue against total ad spend before trusting the platform's number.
Every figure in this article comes from the ROAS Chart calculator, and the screenshots show it with the same numbers. The formulas are written out on the math behind it.