· Updated · 3 min read · ROAS Chart
What is ROAS? Meaning, formula, and what it doesn't tell you
ROAS means return on ad spend: how much revenue your ads bring in for every dollar they cost. It is the number every ad platform reports and every media buyer is judged on, simple to calculate and easy to misread. Here is what it measures, and what it leaves out.
What does ROAS mean?
ROAS stands for return on ad spend. It is the revenue your ads brought in divided by what you spent on them, so it tells you how much in sales each dollar of advertising produced.
ROAS = revenue from ads ÷ ad spend
Spend $8,000 on ads, make $32,000 of sales from them, and your ROAS is $32,000 ÷ $8,000 = 4.00x. It is sometimes written as a percentage: 4x is 400%. Google Ads uses the percentage form for its target ROAS setting.
How the platforms calculate it
Meta, Google and TikTok each report ROAS for your campaigns. They divide the purchase value they attribute to your ads by what you spent. "Attribute" is the important word: each platform decides which sales its ads caused, using its own rules and time windows. Their numbers are useful for comparing campaigns, and usually more generous than your store's own records. See MER vs ROAS for how to check them.
What ROAS does not tell you
ROAS counts revenue. It does not know what that revenue cost you: the product, the shipping, the payment fees, the refunds, or the rent. So a ROAS on its own cannot tell you if you are making money. For that you need to compare it with your break-even ROAS, the ROAS at which your sales exactly cover all of those costs.
Here is the example above on the chart. The store sells gifts at an average of $50 with a 60% gross margin; after shipping, fees and refunds, each order leaves $22.00. Fixed costs are $5,000 a month.
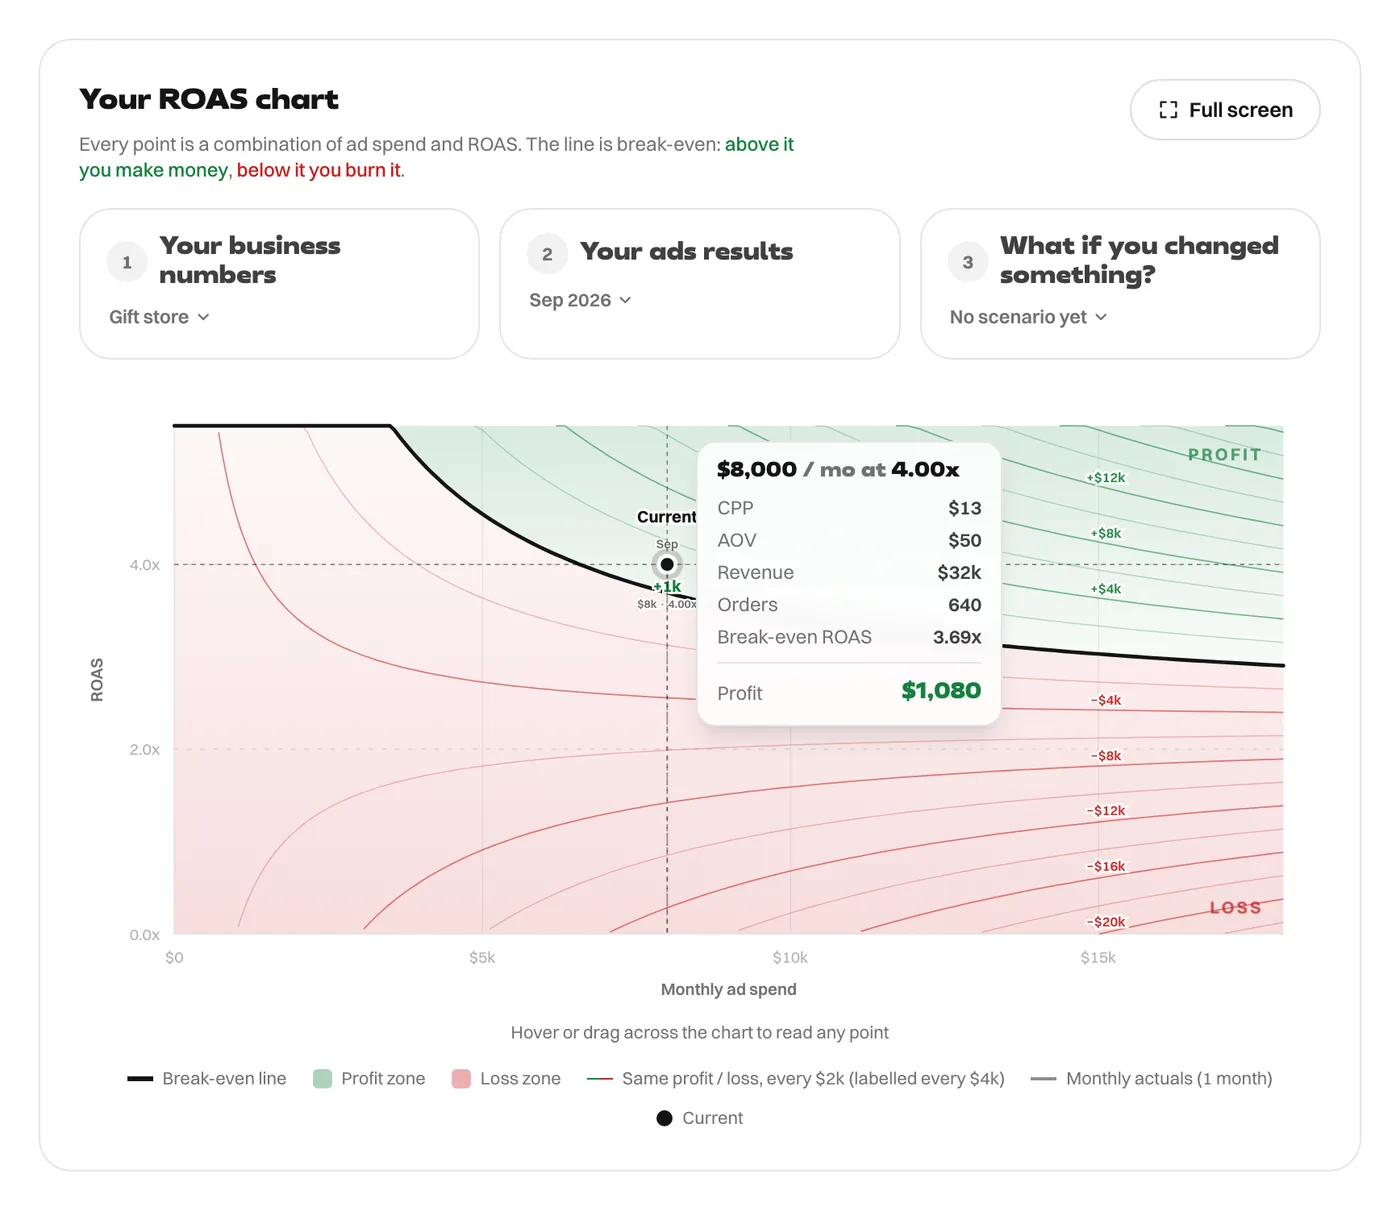
Break-even at $8,000 is 3.69x, so a 4.00x ROAS makes $1,080 this month. The same 4x would be a loss at $4,000 a month, where break-even is 5.11x, because the fixed costs are spread over less revenue.
Reading any ROAS
- Below your floor (1 ÷ contribution margin, here 2.27x): every order loses money, at any budget.
- Between the floor and break-even: you cover the cost of each order but not your fixed costs. More volume at the same ROAS can fix it.
- Above break-even: you are making money at this spend.
That is also the honest answer to "what is a good ROAS": any ROAS above your own break-even line, at the budget you are running. The number that is good for one store loses money for another. What counts as a good ROAS works through 2x, 3x and 4x with real stores.
Go deeper
Everything on this blog builds on those three ideas. A good order to read them in:
- The break-even ROAS formula that includes fixed costs
- Contribution margin vs gross margin
- Minimum ROAS: the floor your ads can never go below
- ROAS vs ROI: why a 4x ROAS can still lose money
- Why ROAS drops when you scale, and how to know when to stop
- How to make your ROAS profitable without touching the ads
- Unit economics for ecommerce
Or, for a specific ROAS: is 2x good, is 3x good, is 4x good. For platform settings: target ROAS in Google Ads and the ROAS goal in Meta. For UAE sellers: VAT on Meta ads and cash on delivery.
Every figure in this article comes from the ROAS Chart calculator, and the screenshots show it with the same numbers. The formulas are written out on the math behind it.